Gravity is not uniform. It varies geographically.

Image: USGS
- The law of gravity may be universal, gravity itself varies considerably across the earth.
- Most factors can be mathematically accounted for; local geology is the odd one out.
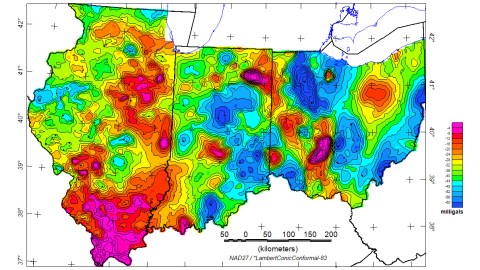
- Bouguer gravity anomaly maps like these show regional gravitational variation.

Isaac Newton’s apple tree at Woolsthorpe Manor, Lincolnshire. In the background: the house where he was born.
Image: arthurmarris, CC BY-SA 3.0
Apple and tree
What a weird place this planet is. But especially southern Illinois, according to this map of gravity anomalies across three Midwestern states.
Gravity is what made the apple fall from a certain tree (in Woolsthorpe, Lincolnshire), causing Newton to wonder why it fell down straight. But the law of universal gravitation he formulated (and published in 1687) by way of explanation is a lot less uniform than you’d think.
For gravity does vary across the earth, meaning Newton’s apple has a slightly different weight in various other parts of the world and falls at slightly different speeds. That’s due to a combination of four factors.
- First, there’s a latitudinal effect. The earth is not perfectly round: it’s flatter nearer to (and flattest at) the poles and bulges more towards (and most along) the equator. As a result, the distance from the earth’s center to sea level is 13 miles (21 km) greater at the equator than at the poles. The latitude you’re at has an effect on gravity, with polar and equatorial extremes: Newton’s apple (and you) weigh 0.5% more at the poles than at the equator.
- Secondly, there’s a rotational effect. That difference in gravity between the poles and the equator is only partly due to gravity itself; it’s also caused by the fact that the earth spins faster at the equator.

Bouguer gravity anomaly map of Illinois, Indiana and Ohio. Red means higher than average anomalies, blue means lower than average ones.
Image: USGS
Invisible elevations
- Then there’s an altitudinal effect. Earth’s gravitational pull depends on your distance from its center. Gravity diminishes with altitude – but again, with fairly limited effect. If you’re 16,400 feet (5 km) up a mountain, you weigh 99.84% of what the scales would say at sea level.
- Fourth differentiator: the tidal pull of the moon and sun. Although this has visible, repetitive and significant effects – the ebb and flow of sea levels – the variations this causes in the earth’s gravity are very small indeed.
- Final factor: an area’s geological makeup. The density of certain rock types has an effect on the force of gravity. Areas with higher subsurface rock density have higher than average gravity, and vice versa. Mountains increase gravitational density, ocean trenches decrease it. The effect is usually not greater than 0.01%.
While the first four factors can be compensated for mathematically, it’s the local geology which produces random gravity anomalies of the kind mapped here.
This is a Bouguer gravity anomaly map, showing gravity variations resulting from lateral density variations in the earth. It looks like a relief map of invisible elevations and imperceptible depressions, grouped together in plateaus and peaks of higher-than-average pull and valleys and troughs of lower-than-average gravity.

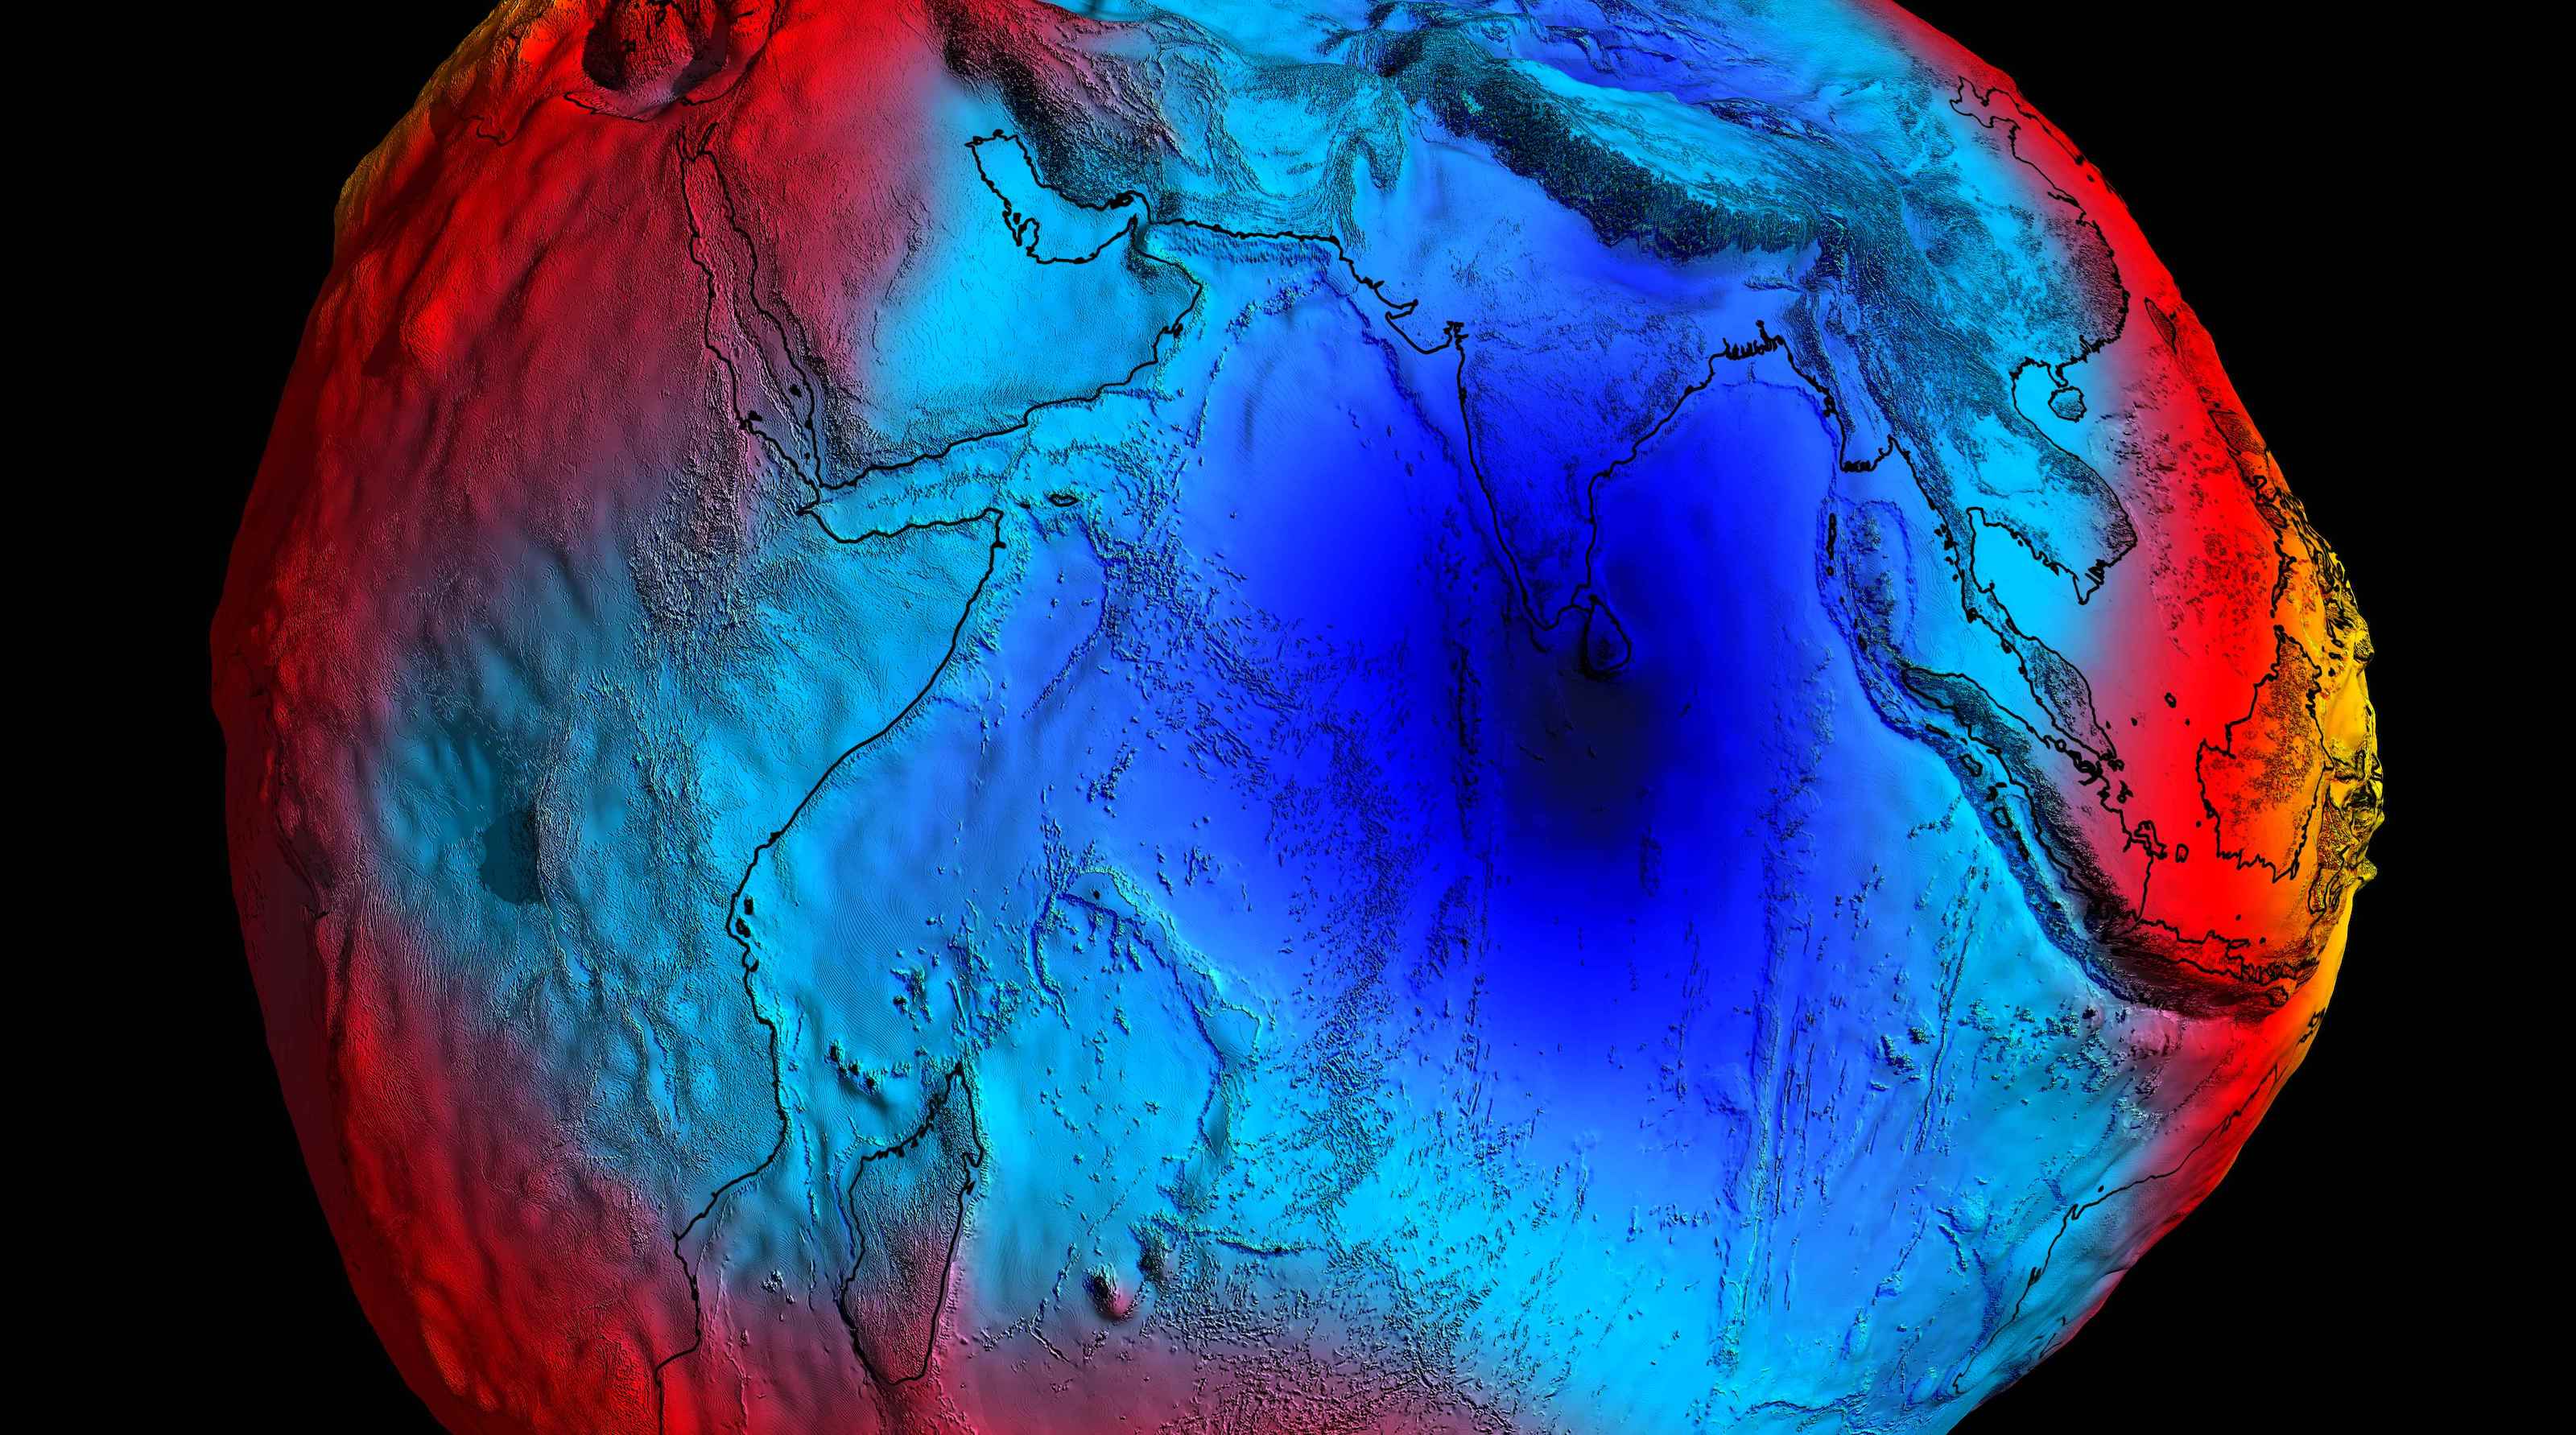
Of course, gravity anomalies are not exclusive to Illinois, Indiana and Ohio. Here’s a gravity anomaly map of the entire earth, in two hemispheres.
Image: NASA
Global anomalies
The Bouguer (pronounced boo-gay) gravity anomaly is named after French scientist Pierre Bouguer (1698-1758), a prodigy who succeeded his father as professor of hydrography at the tender age of 16. Among his many discoveries was the fact that small regional variations in the earth’s gravity field could be related to the varying density of subterraneous rocks in the subsurface.
The values on this map are expressed in milligals, 1/1000th of a Gal (short for Galileo), which is the unity of gravity, equal to 1 cm/sec2. Positive anomalies (i.e. greater density than average) occur in areas colored red. Negative anomalies (less density than average) are found in areas colored blue.
It looks like Newton’s apples weigh a bit more in southern Illinois than they do on average, and a bit less in central Indiana and large parts of Ohio. While these anomalies may only account for variations in decimal points, the difference is big enough to have measurable effects: these gravitational anomalies cause the sea to bulge in certain places, and throw pendulum clocks out of sync.
What’s the anomaly in your neck of the woods? Check out this page at the International Gravimetric Bureau.
Strange Maps #999
Bouguer gravity anomaly map found here at the USGS. Map of global gravity anomalies found here at NASA‘s Earth Observatory.
Got a strange map? Let me know at strangemaps@gmail.com.


