Using the Nabro flow satellite images to estimate magma viscosity (UPDATED)

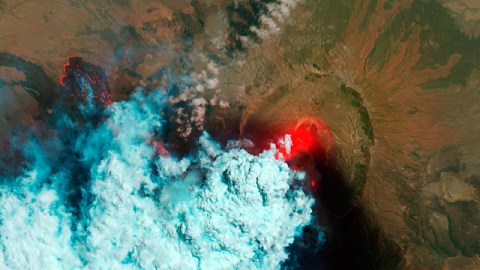
The NASA Earth Observatory has been doing an excellent job of monitoring the eruption at Eritrea’s Nabro using all their eyes in the sky. The latest image, taken from the EO-1 Advanced Land Imager (see below) suggests that the lava flow on the western side of the caldera has moved approximately 100-150 meters in the period between June 24 to 27. This got me thinking – can we do a back-of-the-envelope calculation to figure out the viscosity of the Nabro lava as a way to further support its basaltic nature? The answer is “yes”*!
*UPDATE: Well, closer to “maybe”. There were some errors in the original post that I’ve fixed and it now appears that we have a lot more room for interpretation than we did before.

June 27 EO-1 ALI image of the Nabro eruption, courtesy of the NASA Earth Observatory. Click here to see a larger version and here to compare with a June 24 image (or top left).
There are a lot of factors that control viscosity in magma – the silica content, the crystal content, the gas content and temperature. Basaltic magma is hot, crystal-poor, gas-poor and silica-poor (relative to rhyolite), so you expect that a basalt should have a lower viscosity than a rhyolite. In fact, a hot basalt will have a viscosity that is ~10,000,000,000 times lower than a cool rhyolite (see figure below). That is a remarkable range of viscosities and helps explain the widely different behaviors of volcanoes, as the viscosity of the magma will control how well gases can escape. In low viscosity magmas, like basalt, gases can escape easier so there is less of a chance of explosive eruptions. Rhyolite is the opposite, where the high viscosities mean bubbles get trapped and explosions follow as the magma becomes overpressured with bubbles. This is why basaltic volcanoes like Kilauea have lava flows and rhyolite volcanoes like Chaiten have explosions (of course, you can get explosive basalt and flowing rhyolite depending on how all the factors listed above change).

The viscosity of magmas as a function of temperature. Magma is assumed to be volatile free. Figure from Spera, 2000.
UPDATE 4 PM:I’ve had to fix my calculations after a reader noted I erroneous put 2.9 kg/m3 for the density of basalt. It should be 2900 kg/m3 … and as you can imagine, it changes things a lot.
So, how can we estimate the viscosity of a flowing lava, like we see at Nabro? We can use the Jeffrey’s Equation (Jeffreys, 1925; see below) to estimate the viscosity of a flow down a slope.

In this equation, h is viscosity, v is velocity, r is density, q is the slope angle, g is acceleration due to gravity (9.8 m/s2) and d is the flow thickness. (Sorry about the lack of greek characters). For Nabro we can use what we know of the lava flow to make some educated guesses about some of these variables:
Velocity: Looking at the NASA EO images and Google Earth, it looks like the lava flow has travelled ~12.1 km since the eruption began on June 13. Now, whether the lava flow started June 13 or later is hard to know, but to use an endmember situation, I will assume the flow started on Day 1, so it has travelled 12.1 km in 14 days, for an average velocity of ~0.01 m/s.
Density: Here we get a little circular logic, where we have to guess a density in order to confirm the composition. I used basalt – 2900 kg/m3
Slope angle: Again, I used the NASA EO images and Google Earth to get a slope angle. Assuming the flow travelled 12.1 km and the elevation change was roughly 555 meters, the slope angle is 2.6 degrees.
Flow thickness: This is the trickiest one as I’ve seen no reliable measurements of this anywhere. Some news reports are quoted as saying the snout of the flow is 15 m, but that is like an end-member thickness where flows can inflate. Based on looking at some of the images of the flow, I might guess the flow might be, on average, 5 m thick. I’ll come back to this later.
If we dump all of these variables into the Jeffreys Equation, we get a viscosity of ~867,845 (8.6×10⁵) Pa*s (~8.6×10⁷ poise). If we look at the range of viscosities for basalt, it is ~10-100 Pa*s in normal conditions, so my estimated viscosity is a too high, more in line with cool andesite (100-10000 Pa*s) or hot dacite (105-108 Pa*s). There are a lot of estimates here, so if I vary some of the variables a little, such as flow thickness, you can change the viscosity to ~3.5×10⁵ Pa*s (with a 10 m thickness) or ~1.4×10⁵ Pa*s (with a flow thickness of 2 m). Similarly, if I assume the flow started on June 17 instead of June 13, the velocity becomes higher – 0.014 m/s – and the viscosity at 5 m thickness is closer to 6.2×10⁵ Pa*s. UPDATE: Another variable that could change is the distance the flow has moved. Robert Simmon from the NASA EO thinks the flow might have travelled 15 instead of 12 km. Plugging this in, it gives a viscosity of ~7.2×10⁵ Pa*s (vs. 8.6×10⁵ Pa*s).
In fact, we could use this velocity measurement to infer when the flow might have started by assuming that the viscosity should be ~100 Pa*s (the high end for 100% molten, volatile free basalt). If the only variable changing is velocity, we’d need a velocity roughly 100x faster, meaning the flow was moving at 85 km/s – and that isn’t realistic.
So, why is the calculated value so different than the experimentally-derived viscosities of basalt? That is where the factors I listed above come into play. First off, if the magma is a basaltic andesite rather than a basalt, meaning a higher silica content), the viscosity might be higher than we estimated from the graph (above). The Jeffreys Equation assumes a crystal free magma, but if significant crystallization has occurred, then the viscosity will increase as well. As you add solids to the melt, the viscosity will increase up to 3x. The photos and video of the lava flow suggest the lava is very a`a (chunky) at the snout of the flow, suggesting a very high proportion of solid material in the lava, drastically increasing the viscosity.
That still doesn’t get us from ~100 Pa*s to 8.6×10⁵, so we might need to rethink some of the estimates elsewhere. Most likely culprits are the velocity of the flow and the slope. If the slope changes radically over the distance travelled, then the instantaneous viscosity can change significantly – if the slope changes from 5 degrees to 0.1 degree, the viscosity can vary along the distance of the flow (remember, the velocity and thickness will likely vary with slope as well). There is a lot of wiggle room in these calculations (as you can see), but it does give us some idea of the potential petrologic properties of the Nabro lava, even before we can pop it under an electron microprobe or petrographic microscope.
References
Jeffreys, H., 1925, The flow of water in an inclined channel of rectangular section, Phil. Mag., 49, 793-807.
Spera, F.J., 2000. Physical Properties of Magma, in: Sigurdsson, H. (Ed.), Encyclopedia of Volcanoes. Academic Press, San Diego, CA, pp. 171-189.


