5 brilliant graphs that teach correlation vs. causality

Big Think has been talking about the dangers in confusing correlation with causality for some time. You know, how the amount of one thing seems to correspond to something else, and can we therefore conclude that the first caused the second, or vice versa? Nope. Make that a double-nope.
We’ve written about a university course that uses heavy metal to keep students from falling into this trap. And even ended our relationship with blogger Satoshi Kanazawa over this issue.
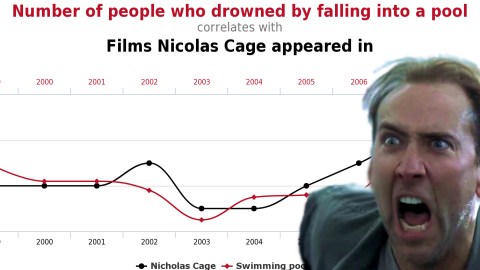
Sometimes things just look like each other without actually being at all connected. Here’s the Nic Cage/drowning data:

(TYLER VIGEN)
It’s not just an academic matter, either, as the confusion between correlation and causality can lead to dangerously wrong conclusions as it has for the people who incorrectly believe vaccines cause autism.
So let’s have some fun with this, and enjoy just how idiotic the correspondences between obviously unrelated data sets can be. All of these are from author Tyler Vigen’s awesome collection, including the Nicolas Cage/drowning one above. He also has a book, Spurious Connections. These are some of our favorites from Vigen’s web page.
Here’s a graph that “proves” that the more the U.S. spends on space, the more our suicide rate by hanging and other forms of asphyxiation goes up.

There are lots of reasons to question the value of the Miss America pageant, but this is new. The winner’s age seems to cause murders by heat.

In what has to be the best endorsement for arcade game-playing, look at how many computer doctorates it “produces.”

And finally, for those of us who have always resented those Scripps spelling smartypantses, venomous spiders feel us. And then bite us.

Got enough proof now for any argument that’s based on ridiculous correspondences? There are more over at Vigen’s website, and they’re all pretty hilarious.


