How do we measure the size of things in an expanding Universe?
When we look across the Universe, we find that things used to be closer together in the past. So how large do things appear when they’re very far away?
“Life is a constant oscillation between the sharp horns of dilemmas.”
-H. L. Mencken
One of the most surprising and fascinating developments of the past century, as we’ve come to understand the Universe better, is not only that there are billions of galaxies beyond our own, but that practically all the galaxies and clusters of galaxies are expanding away from one another! With this in mind, this week’s question comes from Garmt de Vries-Uiterweerd, who asks the following based on an image he saw:
I saw today’s Astronomy Picture of the Day about Baryon Acoustic Oscillations and thought it would make a nice topic for a post on Starts With A Bang.
Here is the image in question.
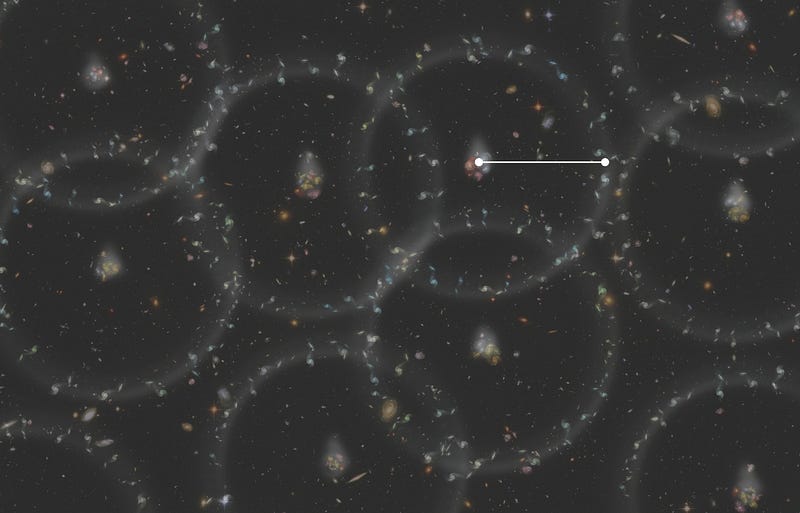
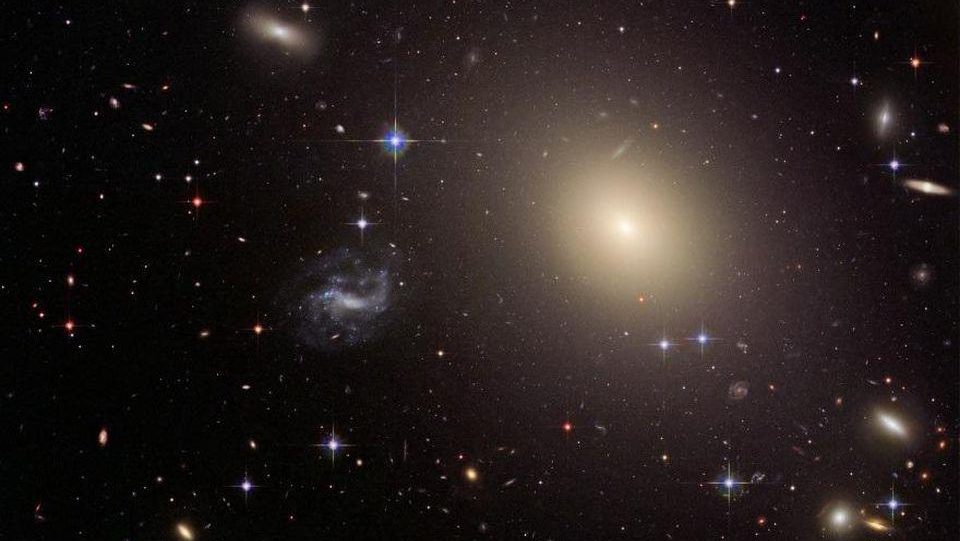
So what is this image, and what’s it all about? To understand it, I want you to imagine the Universe as it is today: full of a great cosmic web of galaxies clumped and clustered together. If we looked at a “slice” of Universe — or a thin line somewhere across the sky — we can map out exactly how this has played out in our neighborhood of the cosmos.
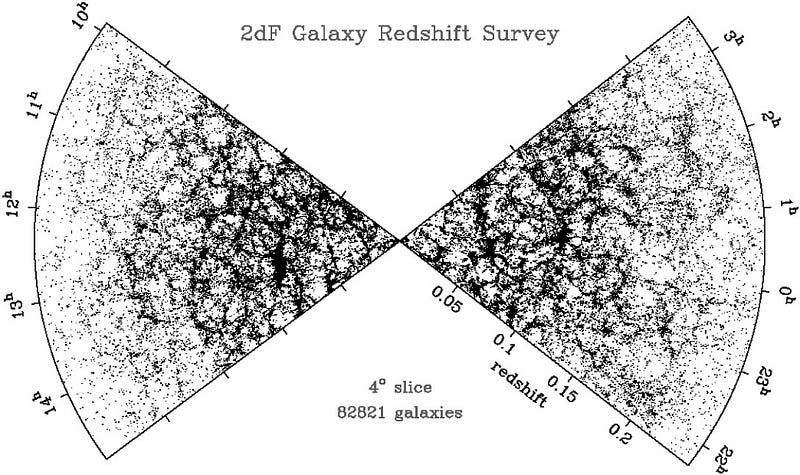
In the late 1990s/early 2000s, the 2dF Galaxy Redshift Survey was at the cutting edge of this. It found that galaxies are clustered together in a great cosmic web, where the densest clusters contain many thousands of Milky Way-sized galaxies and up, and there are also great cosmic voids, or places millions of light years on a side where there isn’t a single galaxy to be found.
This is a beautiful picture, but you must remember, the Universe didn’t always look like this. Remember, some 13.8 billion years ago, the Universe was not only hotter, denser and smaller, but it was also more uniform. As it’s expanded and cooled, the slightly overdense regions have preferentially attracted more and more matter, while the less dense regions have been unsuccessful at that, and have lost their matter to the surrounding, denser areas of space. If we model this and scale the Universe’s expansion out, we can simulate exactly how the structure in our Universe has evolved.
And it’s beautiful.
Why did the Universe wind up forming the patterns of large-scale-structure that it has, and not some other patterns? Why didn’t it form a more-or-less uniform web? Why aren’t the spacings between filaments and clusters larger or smaller on average?
These are really good questions, and whether we look at the actual large-scale-structure (above) present in our Universe, both locally (i.e., today) and far away (i.e., in the past), or whether we look at a simulation (below) of how this structure ought to form, we can figure out what would have made things appear different in those various fashions.

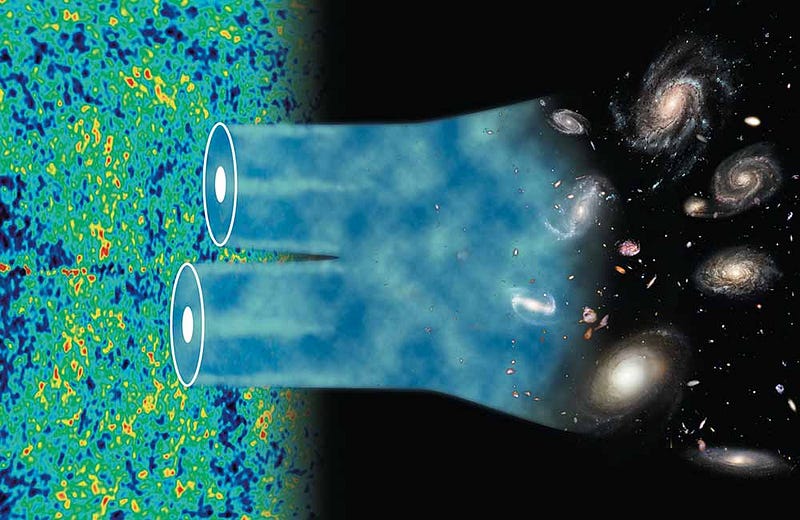
To understand it, we have to go all the way back to when the Universe was much younger than it is now, and also hotter and denser. Under those early conditions, radiation was more important than matter in terms of structure. Sure, gravity’s always working, and matter — both normal and dark matter — both want to collapse into bound structures. But radiation exerts an outward pressure, preventing this from happening.
Here’s the important thing, though: radiation, especially high-energy radiation, has a large cross section with charged, normal matter, like electrons and (to a lesser extent) protons and other nuclei. But not with dark matter! So if you have a Universe with radiation, dark matter and normal matter, what’s going to happen when the matter tries to collapse?
The normal matter gets pushed out in a “rippling” motion from the radiation pressure, but not the dark matter! If you consider, instead of one gravitational source, like the above animation, a realistic distribution of overdensities and underdensities, you get a complex pattern. It looks like a bunch of different overlays of the animation above, superimposed atop one another.
Over time, the densities of the “high peaks” grow, and that’s where galaxies preferentially form. But one useful way to measure how this structure grows and forms is to find a galaxy and then ask yourself the following question:
If I look at the space located a certain distance away from this galaxy, how likely am I to find another galaxy?
That’s an amazingly powerful question to ask, because if you can successfully measure the answer to it, you’re going to learn something incredible.
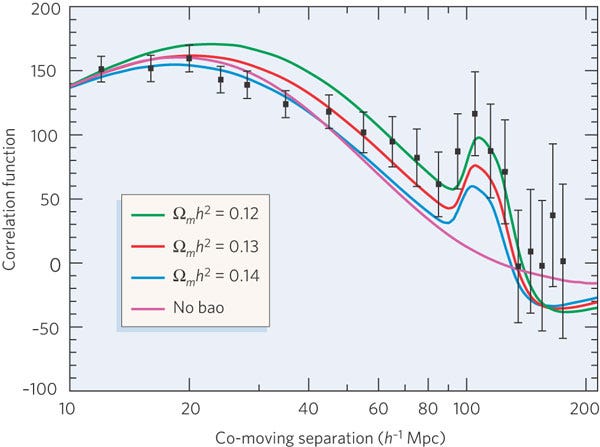
You’re going to learn three separate things about the Universe:
- What percentage of the matter is normal matter,
- What percent is dark (non-baryonic) matter, and
- How quickly the Universe has expanded since, or what percent of the Universe is dark energy!
The first two might seem obvious, but the third is very special. Let me explain.

Imagine you’ve got a candle. You know, intrinsically, exactly how bright this candle is. When you see a light source out there in the Universe that you know is this exact candle, all you need to do is measure how bright the candle appears, and you automatically know exactly how far away it is. This is because there’s a well-known relationship between apparent brightness and distance, so if you know, intrinsically, how bright the thing is, you can infer how far away it must be to give you the brightness you observe. That’s a distance indicator known as a “standard candle.”
But you don’t need a candle to make this type of measurement. It would work just as well if, instead, you had a “standard ruler.”
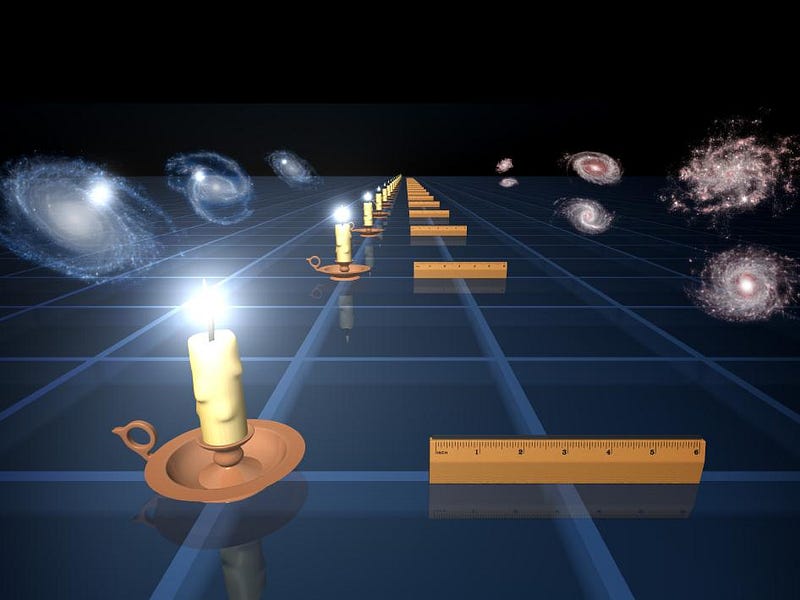
If you know how big your ruler is intrinsically, and then you measure how big it appears to be, you can automatically know how far away it really is!
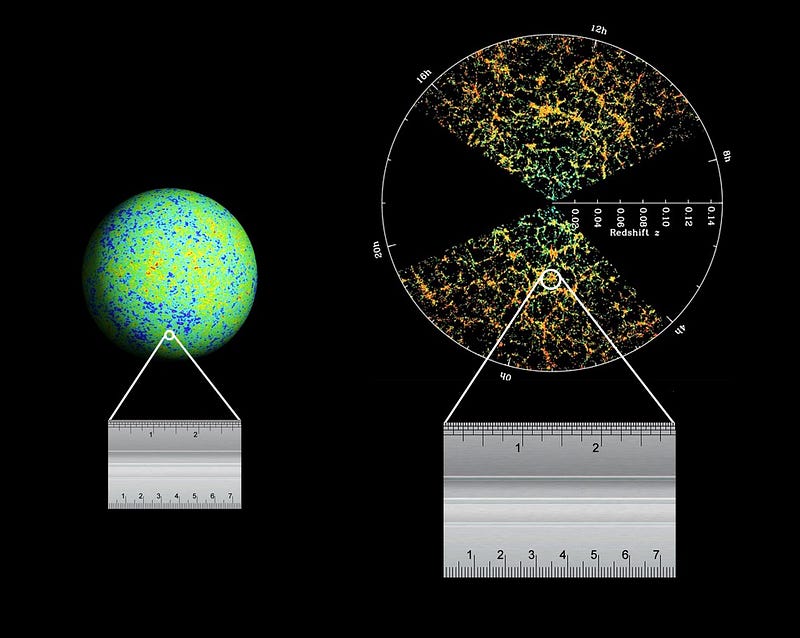
That’s the big idea behind baryon acoustic oscillations: this clumping pattern is the same everywhere in the Universe, and all the different regions of the Universe have the same amounts of normal matter, radiation, dark matter, and dark energy. So if we can look at a region of the sky and measure how big our “standard ruler” appears at that great distance, we can figure out how the Universe has expanded over its entire history!
Three years ago, the WiggleZ team in Australia showed with over 100,000 galaxies that the dark energy we were seeing was consistent with a cosmological constant and not with many of the alternatives. They were able to measure the distance scale of the Universe down to about 4% accuracy. And more recently, the Sloan Digital Sky Survey has tightened those constraints even further, ruling out even more finely-tuned alternatives to the cosmological constant and measuring the distance scale down to a 1% accuracy!
Dark matter and dark energy consistent-with-a-cosmological-constant are here to stay, and the scale is imprinted as far back as the cosmic microwave background!
This is the winning combination of theoretical cosmology: take General Relativity and an expanding Universe, put the ingredients in for what makes it up — including normal matter, dark matter, radiation, dark energy, neutrinos, and anything else you dream up — and a set of initial conditions provided by the Big Bang/inflation, and if the Universe you get out of it matches what we see, we win!
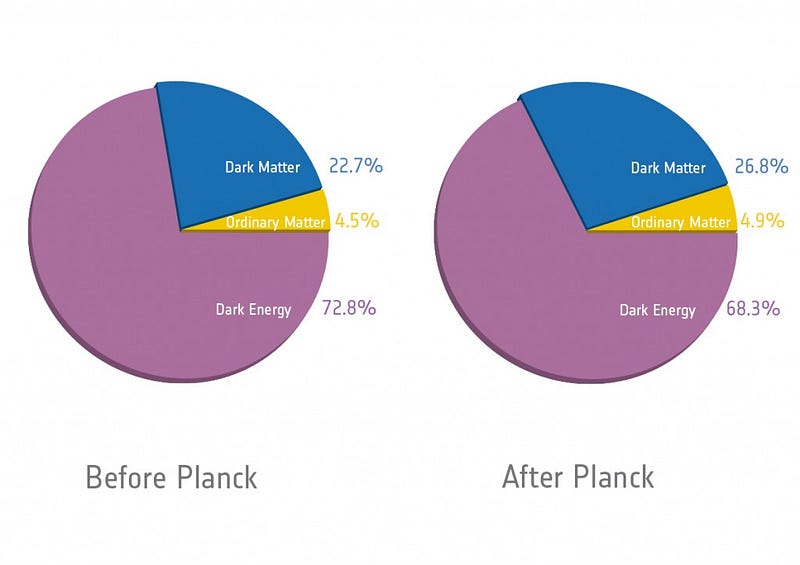
So far, the only working solution is one that has about 4.9% normal matter, 26.8% dark matter, 68.3% dark energy, and a tiny amount (around 0.01%) of radiation sprinkled in there, with a tiny fraction of dark matter in the form of neutrinos.
And that’s consistent with all of our observations: baryon acoustic oscillations, the cosmic microwave background, type Ia supernovae, and everything else we’ve ever observed. This picture — and nothing else — is what our Universe appears to be made of. And this is one way that we know!