The First Climate Model Turns 50, And Predicted Global Warming Almost Perfectly

For those who still don’t believe in global warming, the science has had it right for half a century now.
“Greenhouse gases are the second most important factor for climate, after the Sun.” –Syukuro Manabe
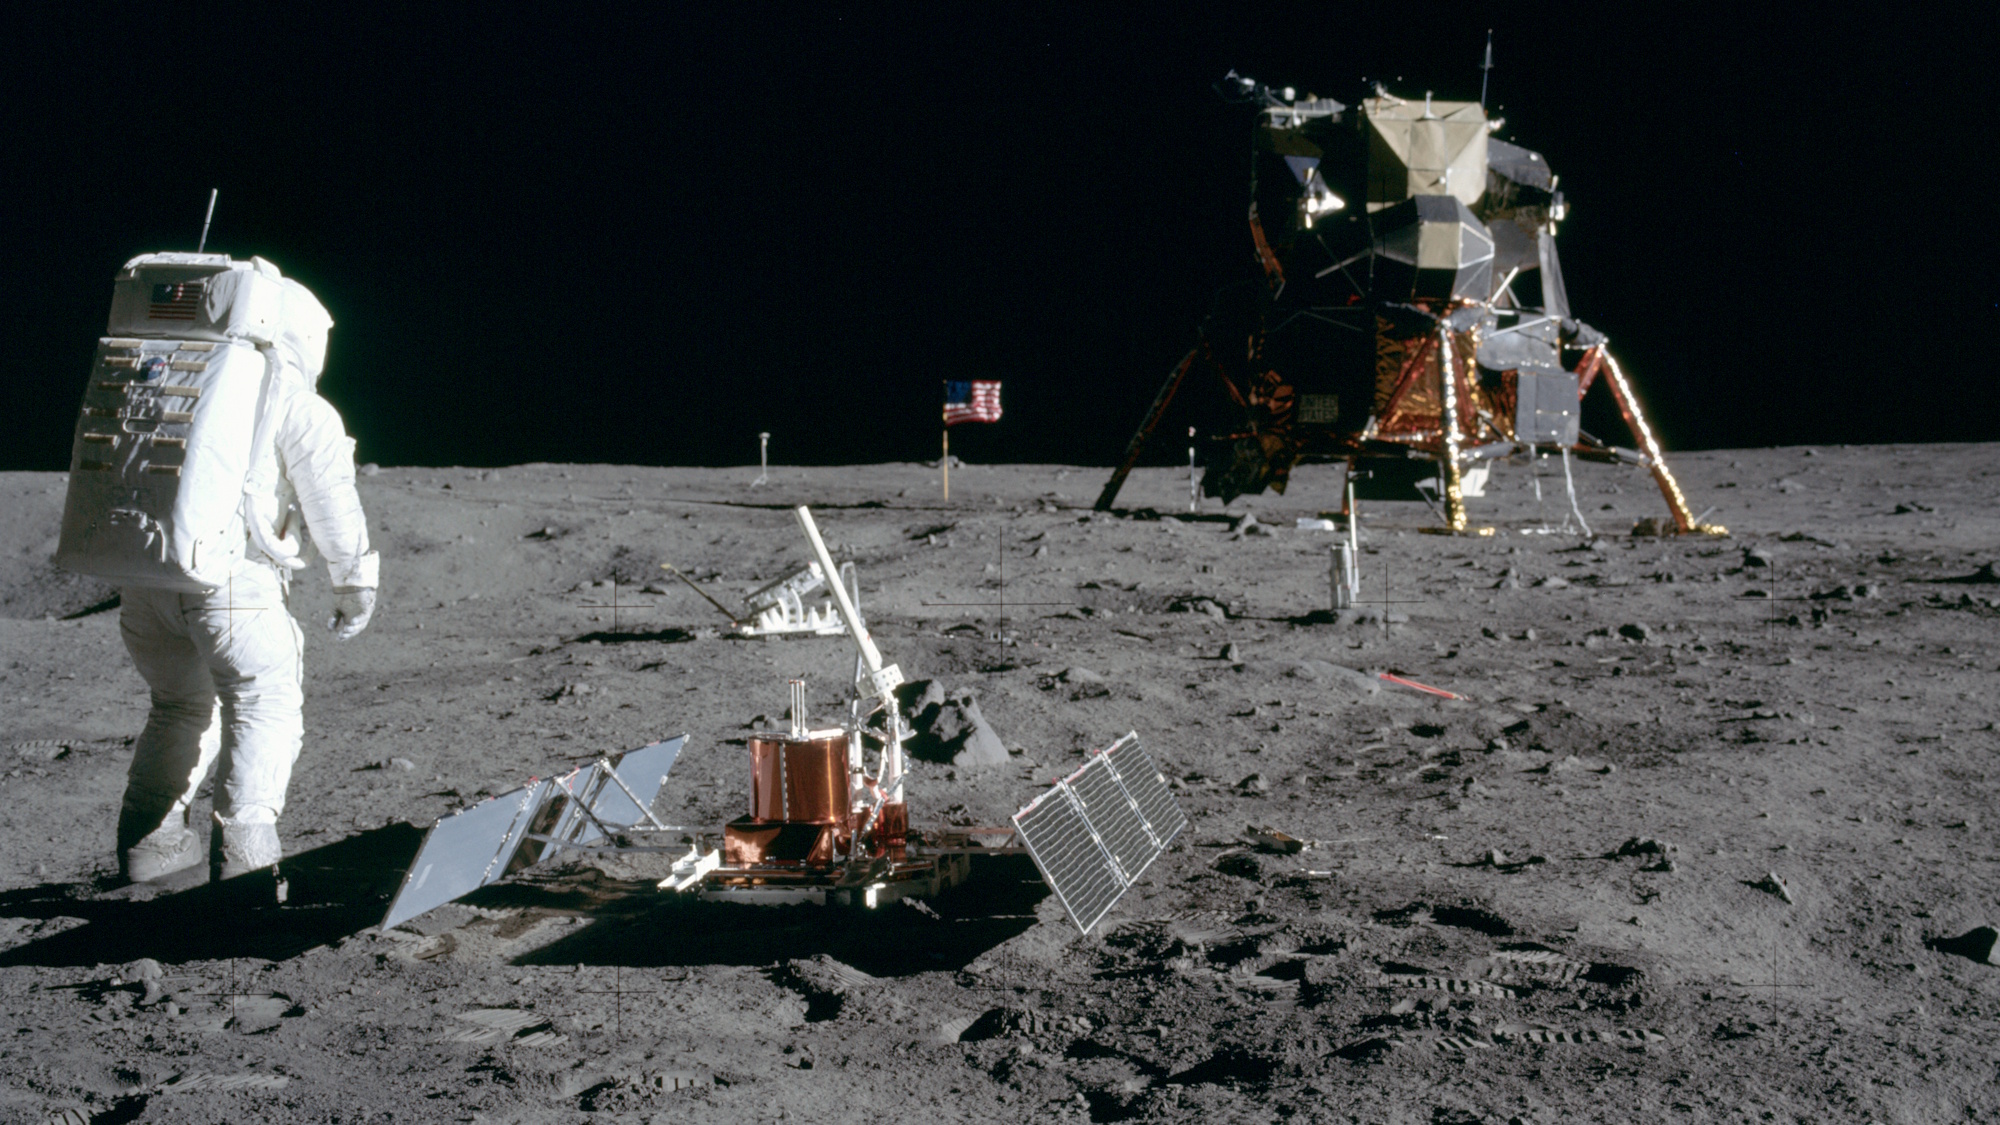
Modeling the Earth’s climate is one of the most daunting, complicated tasks out there. If only we were more like the Moon, things would be easy. The Moon has no atmosphere, no oceans, no icecaps, no seasons, and no complicated flora and fauna to get in the way of simple radiative physics. No wonder it’s so challenging to model! In fact, if you google “climate models wrong”, eight of the first ten resultsshowcase failure. But headlines are never as reliable as going to the scientific source itself, and the ultimate source, in this case, is the first accurate climate model ever: by Syukuro Manabe and Richard T. Wetherald. 50 years after their groundbreaking 1967 paper, the science can be robustly evaluated, and they got almost everything exactly right.

If there were no atmosphere on Earth, calculating the climate would be easy. The Sun emits radiation, the Earth absorbs some of the incident radiation and reflects the rest, then the Earth re-radiates away that energy. Temperatures would be easily calculable based on albedo (i.e., reflectivity), the angle of the surface to the Sun, the length/duration of the day, and the efficiency of how it re-radiates that energy. If we were to strip the atmosphere away entirely, our planet’s typical temperature would be 255 Kelvin (-18 °C / 0 °F), which is most definitely colder than what we observe. In fact, it’s about 33 °C (59 °F) colder than what we see, and what we need to account for that difference is an accurate climate model.
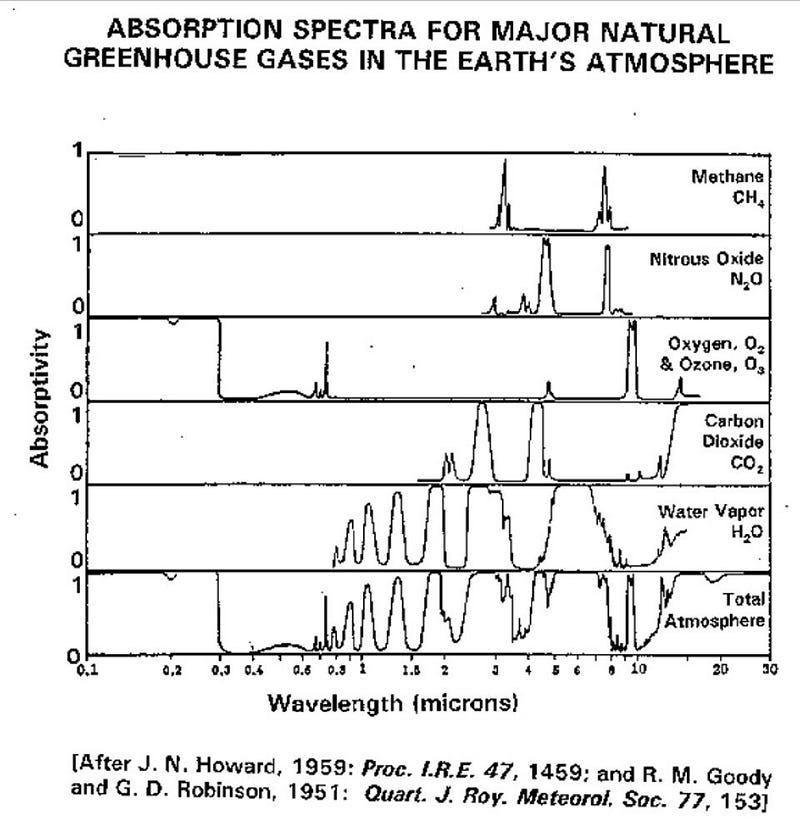
The number one contributor, by far, to this difference? The atmosphere. This “blanket-like” effect of the gases in our atmosphere was first discovered nearly two centuries ago by Joseph Fourier and worked out in detail by Svante Arrhenius in 1896. Each of the gases present has some amount of absorptive effects in the infrared portion of the spectrum, which is the portion where Earth re-radiates most of its energy. Nitrogen and oxygen are terrible absorbers, but good ones include water vapor, methane, nitrous oxide, ozone and carbon dioxide. When we add (or take away) more of those gases from our planet’s atmosphere, it’s like thickening (or thinning) the blanket that the planet wears. This, too, was worked out by Arrhenius over 100 years ago.
But a true climate model is more complex, because there’s more at play than just the atmosphere. The oceans ensure that the amount of water vapor (and cloud cover, which impacts temperature significantly) change dependent on conditions, and if you tinker with one component of the atmosphere — like carbon dioxide, for instance — it impacts the concentrations of other components. Scientists refer to this general process as feedback, and it’s one of the largest uncertainties in climate modeling.
The big advance of Manabe and Wetherald’s work was to model not just the feedbacks but the interrelationships between the different components that contribute to the Earth’s temperature. As the atmospheric contents change, so do both the absolute and relative humidity, which impacts cloud cover, water vapor content and cycling/convection of the atmosphere. What they found is that if you start with a stable initial state — roughly what Earth experienced for thousands of years prior to the start of the industrial revolution — you can tinker with one component (like CO2) and model how everything else evolves.
The title of their paper, Thermal Equilibrium of the Atmosphere with a Given Distribution of Relative Humidity (full download for free here), describes their big advances: they were able to quantify the interrelationships between various contributing factors to the atmosphere, including temperature/humidity variations, and how that impacts the equilibrium temperature of Earth. Their major result, from 1967?
According to our estimate, a doubling of the CO2 content in the atmosphere has the effect of raising the temperature of the atmosphere (whose relative humidity is fixed) by about 2 °C.
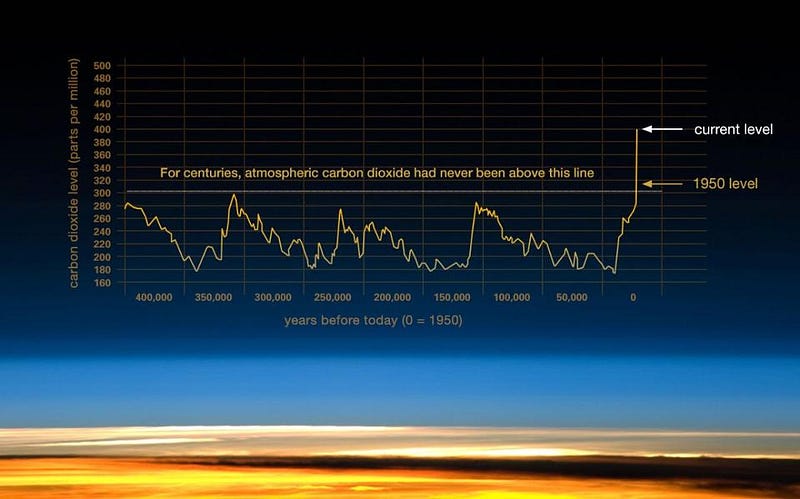
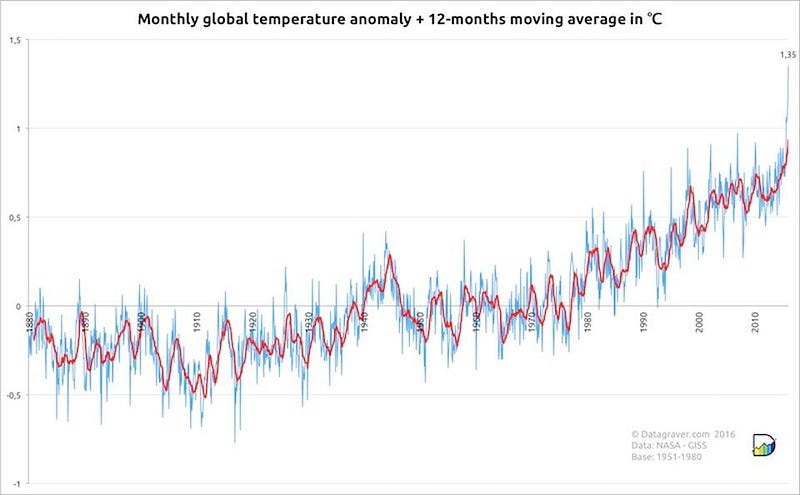
What we’ve seen from the pre-industrial revolution until today matches that extremely well. We haven’t doubled CO2, but we have increased it by about 50%. Temperatures, going back to the first measurements of accurate global temperatures in the 1880s, have increased by nearly (but not quite) 1 °C.
In 2015, all the coordinating lead authors, lead authors and review editors on the last Intergovernmental Panel on Climate Change (IPCC) report were asked to nominate their most influential climate change papers of all time. The 1967 paper by Manabe and Wetherald received eight nominations; no other paper received more than three. The uncertainties surrounding climate sensitivity are still grappled with today, of course, but these were laid out and quantified fifty years ago, and the analysis is still both valid and valuable today. It takes into account clouds, aerosols, stratospheric cooling, water vapor feedback and atmospheric emissions.
According to Manabe himself — still active at age 85 — the modeling of large-scale processes, like atmospheric circulation, is virtually identical today to what it was in the 1960s. Smaller-scale phenomena, like moist convection, cloud processes, and land surface processes were much simpler back then, and have improved in both precision and accuracy, although uncertainties (particularly in clouds) still remain. There are some aspects of models that are ineffective, he notes, but not for the reason people think:
Models have been very effective in predicting climate change, but have not been as effective in predicting its impact on ecosystem[s] and human society. The distinction between the two has not been stated clearly. For this reason, major effort should be made to monitor globally not only climate change, but also its impact on ecosystem[s] through remote sensing from satellites as well as in-situ observation.
And the number one uncertainty that we have to look forward to, according to Manabe? Ice sheet modeling.
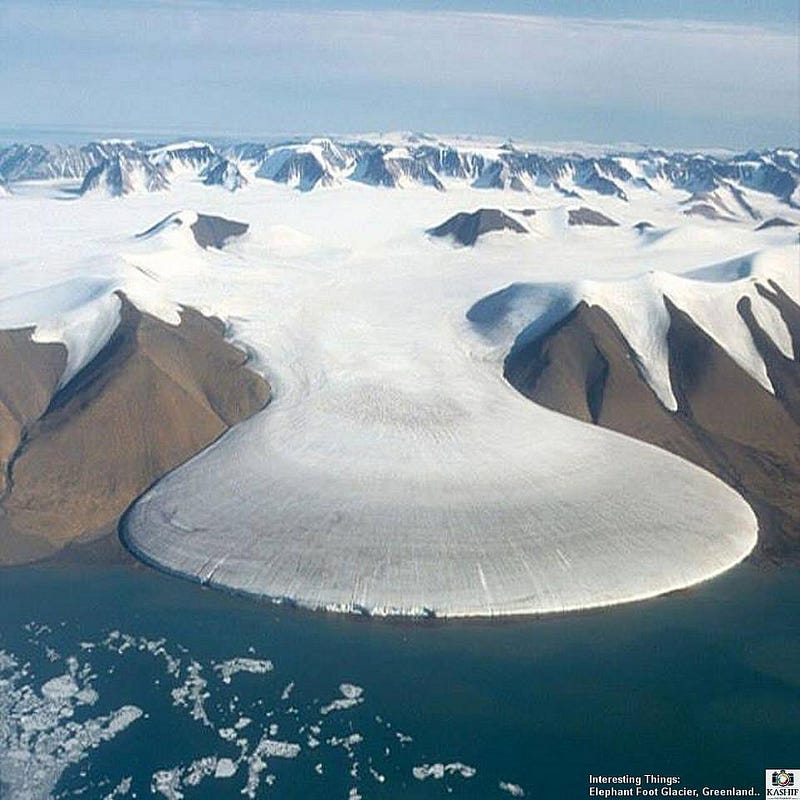
As the globe continues to warm, the ice sheets — particularly over Greenland — will continue to melt. But the rate of melting, the consequences of the melt and the impacts that various processes will have are not only uncertain, they’re unprecedented. If the entire Greenland ice sheet melts, the sea level will rise by approximately 8 meters (26 feet), submerging huge amounts of coastal and low-lying areas around the world, including the majority of the state of Florida. Melting, sliding, percolation and runoff are all sources of uncertainty, and its a combination of modeling and monitoring that’s necessary to understand what’s happening.
We’ve known what’s coming for half a century now, and we’re on the precipice of its arrival. There’s never been a more important time to listen to the science.
This post first appeared at Forbes, and is brought to you ad-free by our Patreon supporters. Comment on our forum, & buy our first book: Beyond The Galaxy!