This Is How Astronomers Will Resolve The Expanding Universe Controversy

When two different techniques give two different results, either someone is wrong, or something incredible is happening.
Imagine you were a scientist attempting to measure some property of the Universe. If you’re curious about the way anything works, you’ll have to find a way to infer not only what’s occurring, but in what amount. This is a difficult task; you want not only the qualitative answer to the question of what’s happening, but the quantitative part as well, answering the question of “by how much?”
In cosmology, one of the great challenges is to measure the expansion of the Universe. We’ve known since the 1920s that the Universe is expanding, although it’s been a quest for the generations to determine “by how much?” There are a number of different groups today using a multitude of different techniques to measure exactly that. The answers they get consistently fall into one of two categories, but are incompatible with each other. Here’s how we plan to solve this conundrum.
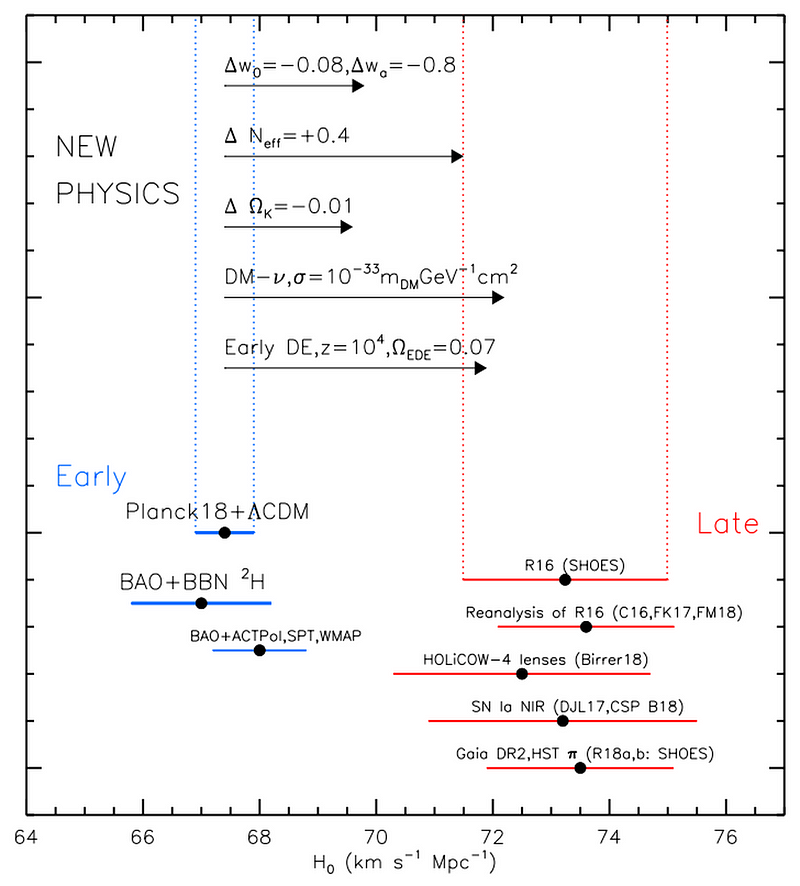
For generations, astronomers, astrophysicists and cosmologists attempted to refine our measurements of the rate of the Universe’s expansion: the Hubble constant. This is why we designed and built the Hubble Space Telescope. It’s key project was to make this measurement, and was tremendously succeessful. The rate it got was 72 km/s/Mpc, with just a 10% uncertainty. This result, published in 2001, solved a controversy as old as Hubble’s law itself.
But in 2019, a new one has arisen. One camp, using relics from the earliest stages of the Big Bang, keeps getting values of ~67 km/s/Mpc, with a claimed uncertainty of just 1–2%. The other camp, using measurements from the relatively nearby Universe, claims ~73 km/s/Mpc, with uncertainties of just 2–3%. These errors are so small that they no longer overlap. Something is wrong, and we cannot figure out where.
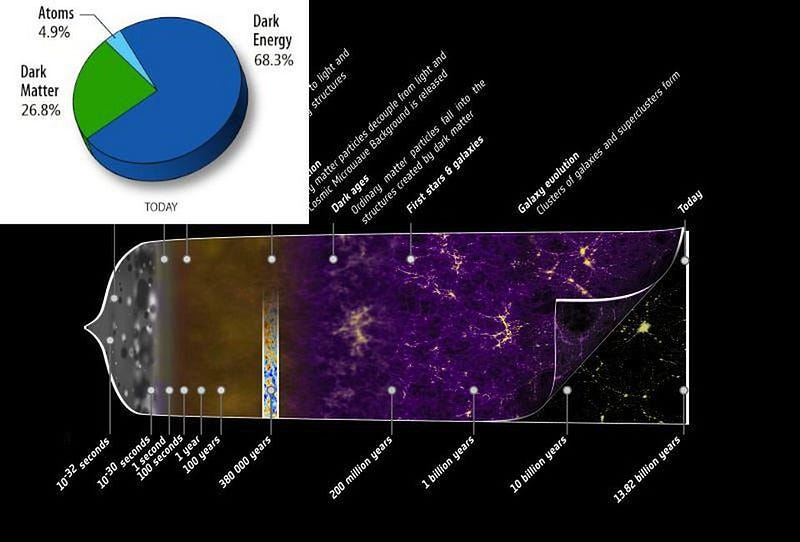
The Universe was smaller, hotter, and denser in the past. Light from any location in space needs to travel through the expanding Universe in order to arrive at our eyes. Ideally, we can measure the light we receive, determine a distance for the signal we measure, and infer how the Universe expanded over its history to result in the signal we actually detect.
The two classes of methods that we use, however, are giving incompatible results. The possibilities are threefold:
- The “early relics” group is mistaken. There’s a fundamental error in their approach to this problem, and it’s biasing their results towards unrealistically low values.
- The “distance ladder” group is mistaken. There’s some sort of systematic error in their approach, biasing their results towards incorrect, high values.
- Both groups are correct, and there is some sort of new physics at play responsible for the two groups obtaining different results.
Of course, everyone thinks they’re right and the other teams are wrong. But the way science works isn’t by derision, but by finding the conclusive evidence necessary to tip the scales. Here’s how astronomers are going to resolve the biggest controversy in cosmology, and learn how the Universe is actually expanding.
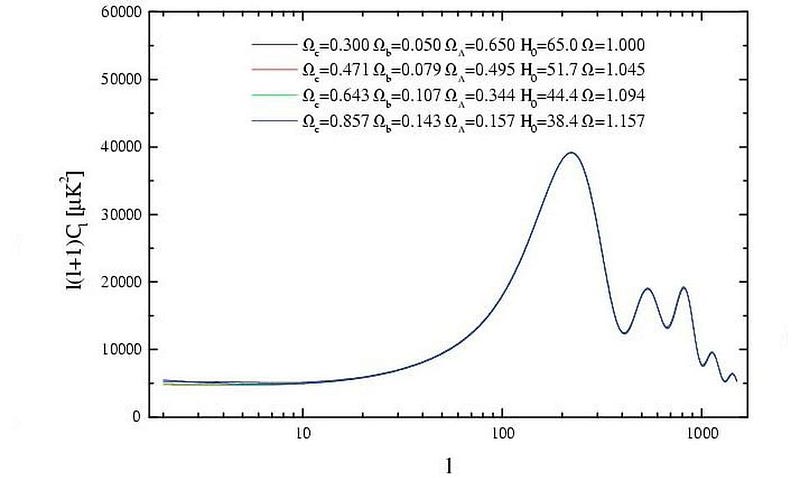
1.) Is the early relics group mistaken? Back before we had the Planck satellite, we had COBE and WMAP. While Planck has given us a map of the Big Bang’s leftover glow down to angular scales of just 0.07°, COBE was only able to get down to about 7° and WMAP, although much better, only got us down to about 0.5°. There was a degeneracy between three separate parameters in the data: the matter density, the expansion rate, and the scalar spectral index. Back in the WMAP era, the data actually favored ~71 km/s/Mpc, although with large uncertainties.
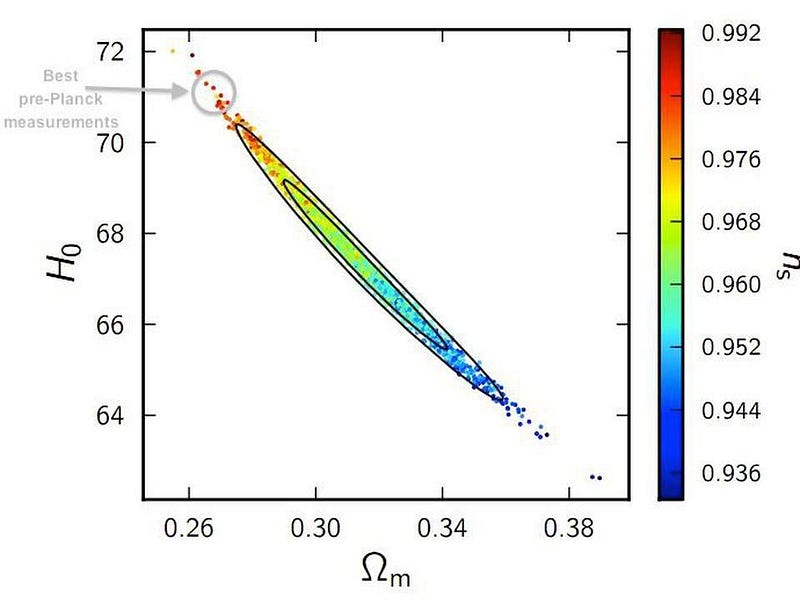
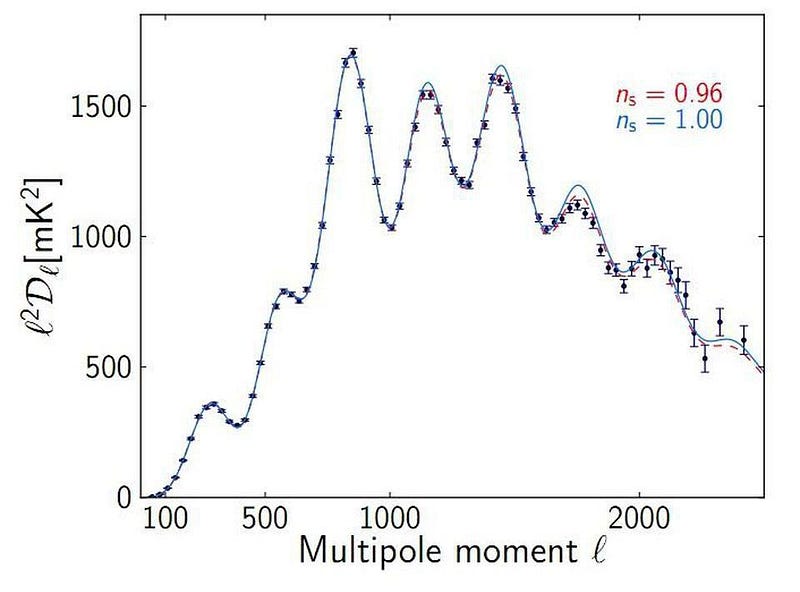
It wasn’t until Planck took us to those smaller angular scales that the degeneracy was broken, and we discovered the expansion rate needed to be low. The reason is that those tiny angular scales encode information about the scalar spectral index (n_s, in the diagram below), which rule out the large values of the expansion rate (and, correspondingly, the small values for the matter density), and teach us that the expansion rate must be closer to 67 km/s/Mpc, with a very small uncertainty.
It is possible, however, that something is incorrect or biased about our analysis of the small angular scales. It would have to not only affect Planck, but other independent CMB experiments. Even if you eschew the CMB entirely, you still get a result showing that an early relic method yields a much lower expansion rate from what the distance ladder indicates.
Although we don’t think this is likely — and the independent early relic technique of baryon acoustic oscillations (or “inverse distance ladder”) also yields consistent results — it’s important to keep in mind that a small error that we haven’t properly accounted for could dramatically shift our conclusions.
2.) Is the distance ladder group mistaken? This is a tough one. There are many different techniques to measure the distances to objects in the expanding Universe, but they all have a few things in common:
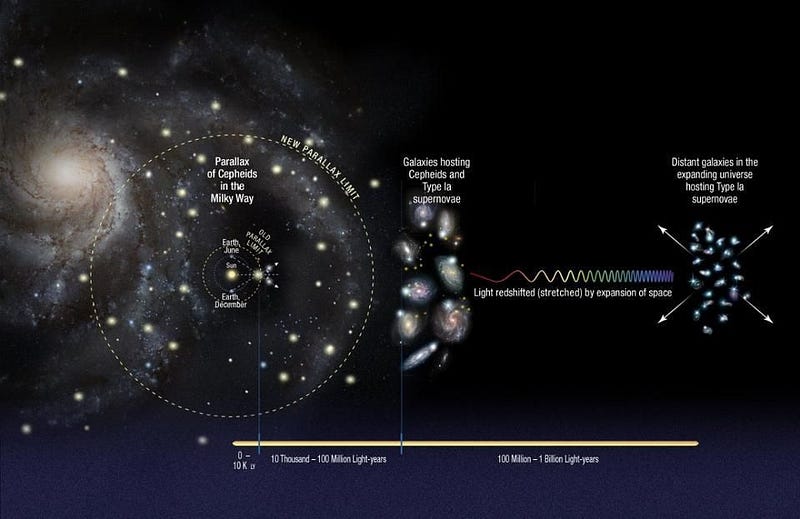
- they start by directly (e.g., geometrically) measuring the distances to well-known, easily seen objects in our own galaxy,
- we then see those same types of objects in other galaxies, allowing us to infer the distance to those galaxies based on the known properties of those objects,
- and some of those galaxies also contain brighter astronomical phenomena, allowing us to use that as a calibration point for probing even more distant galaxies.
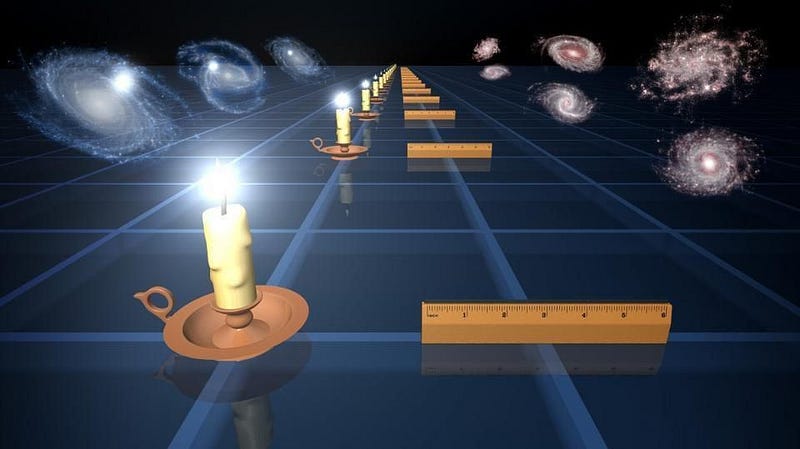
Although, historically, there are more than a dozen different distance indicators, the quickest and easiest way to get out to great cosmic distances now involves merely three steps: parallax to variable stars known as Cepheids in our own galaxy; individual Cepheids in other galaxies, some of which also house type Ia supernova; and then type Ia supernovae all throughout the Universe.
Using this method, we get the expansion rate is 73 km/s/Mpc, with an uncertainty of around 2–3%. This is clearly inconsistent with the results from the early relics group. Understandably, many are concerned about a number of possible sources of error, and the teams working on the distance ladder are very small compared to the teams working on the early relics method.
Still, there are lots of reasons for the distance ladder teams to be confident in their results. Their errors are as well-quantified as one could hope for, there are independent cross-checks on the Cepheid calibration besides parallax, and the only potential pitfall is an “unknown unknown,” which realistically could plague any sub-field of astronomy at any time. Still, there are plans to do even better. These are the multiple ways astronomers will check whether the cosmic distance ladder is truly giving a reliable measurement of the Universe’s expansion rate.
Can we develop a pipeline for distance ladder inputs the way we have for early relic inputs? Right now, there are plenty of programs that can either take a set of cosmological parameters and give you the expected cosmic microwave background, or can take the observed cosmic microwave background and give you the cosmological parameters those measurements imply.
You can see how, as your data changes, parameters like the matter density, dark energy equation of state, or expansion rate vary, along with their error bars.
The distance ladder teams are seeking to develop a similar pipeline; one does not exist yet. When it is complete, we should be able to get an even more accurate read on their systematics, but in a superior fashion to what we have today. We’ll be able to see, when various data points/sets are included or excluded, how both the mean value and the uncertainties in the expansion rate’s value are sensitive to them. (Although, in 2016, there were over 100 models considered in the supernova analysis, and varying between them failed to account for the discrepancy in all forms.)
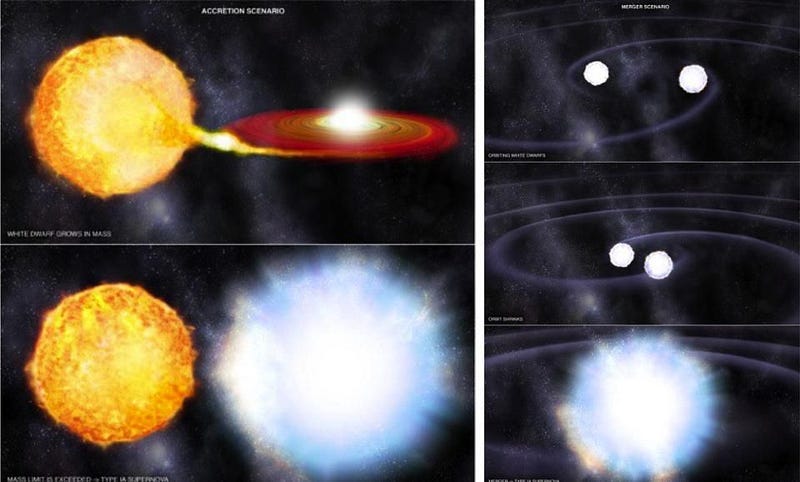
One potential error source could be that there are two classes of type Ia supernova: from accreting white dwarfs and from merging white dwarfs. There are old stars everywhere, meaning we should see merging white dwarfs everywhere. But only in regions where new stars are either forming or have formed recently (known as HII regions) can we get accreting white dwarfs. Interestingly, Cepheid variable stars, which are also part of the distance ladder, are only found in regions that have formed new stars, too.
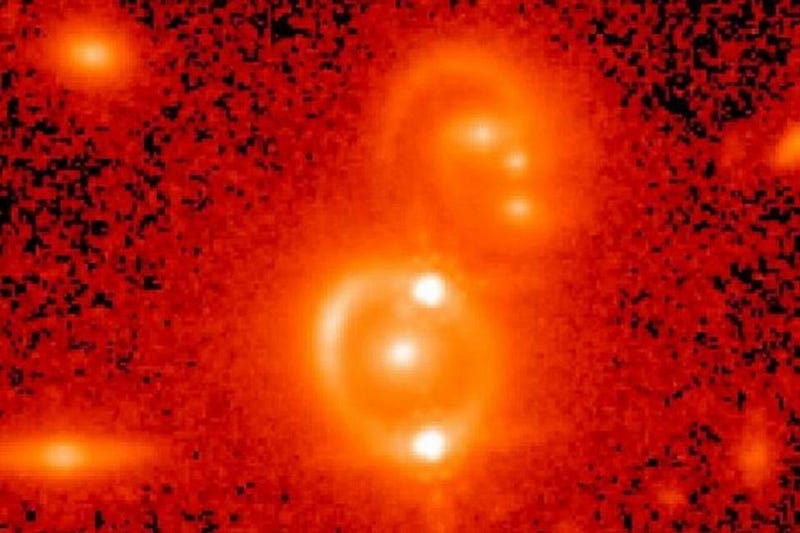
We cannot disentangle which class of supernova we’re seeing when we look in Cepheid-rich regions. But if we look in a location where there are no young stars, we can be certain we’re seeing supernovae from merging white dwarfs. There are good reasons to believe this systematic is small compared to the overall discrepancy, but not everyone is convinced. Using a different intermediate distance indicator, such as evolving stars at the tip of the asymptotic giant branch found in the outer halos of galaxies, will eliminate this potential systematic error. There are currently about a dozen measurements from various distance ladder teams that show good agreement with Cepheids, but more work is still necessary.
Finally, there’s the ultimate sanity check: using a completely independent method that has no distance ladder at all to measure the expansion rate. If you could measure a distance indicator at varying locations all throughout the Universe, both near and far, you’d expect to get a signal that could settle the issue once and for all. However, any new method is going to be hampered by having low statistics and yet-to-be-determined systematic errors.
Even so, there are two ways scientists are trying to do this right now. The first is through standard sirens, which is where you get inspiraling and merging neutron stars, although these will be preferentially close by on a cosmic scale. (We’ve seen one, definitively, so far, but LIGO/Virgo expects many more in the coming decades.) The other is through the time-delay measurements of multiply-imaged signals from gravitational lenses. The first such data sets are coming in now from this, with four known lenses showing agreement with the distance ladder team, but there is still a long way to go.
If this pans out the way many are hoping (and some are dreading), it will mean that we have to resort to the third — and most troublesome — option.
3.) Both groups are correct. It is possible that the way we measure the expansion rate of the Universe is of fundamental importance to the value we obtain. If we measure cosmically nearby objects and look outward, we get a result of around 73 km/s/Mpc. If we measure the expansion rate from the largest cosmic distance scales, we get a result of 67 km/s/Mpc. There are a number of fascinating explanations for this, including:
- our local region of the Universe has unusual properties compared to the average (although this is already disfavored),
- dark energy is changing in an unexpected fashion over time,
- gravity behaves differently than we’ve anticipated on cosmic scales,
- or there is a new type of field or force permeating the Universe.
But before we jump to these exotic scenarios, we have to make sure that neither group has made a mistake. Even a small bias could account for the entirety of this current controversy, despite the multiple independent checks. Our understanding of the very Universe we inhabit is at stake. The importance of performing every due diligence, and making sure we’ve got it right, cannot be overstated.
Ethan Siegel is the author of Beyond the Galaxy and Treknology. You can pre-order his third book, currently in development: the Encyclopaedia Cosmologica.