Throwback Thursday: The Science Of The Cosmic Microwave Background
It’s the leftover glow from the Big Bang. Here’s what it teaches us, and why you shouldn’t worry about “anomalies” in the CMB.
“The radiation left over from the Big Bang is the same as that in your microwave oven but very much less powerful. It would heat your pizza only to -271.3°C, not much good for defrosting the pizza, let alone cooking it.” –Stephen Hawking
One of the most powerful predictions of the Big Bang — the fact that our cold, star-and-galaxy-rich, slowly-expanding Universe came from a hot, dense, much more homogeneous state — was the existence of a bath of leftover, low-energy radiation that should be detectable, even today.
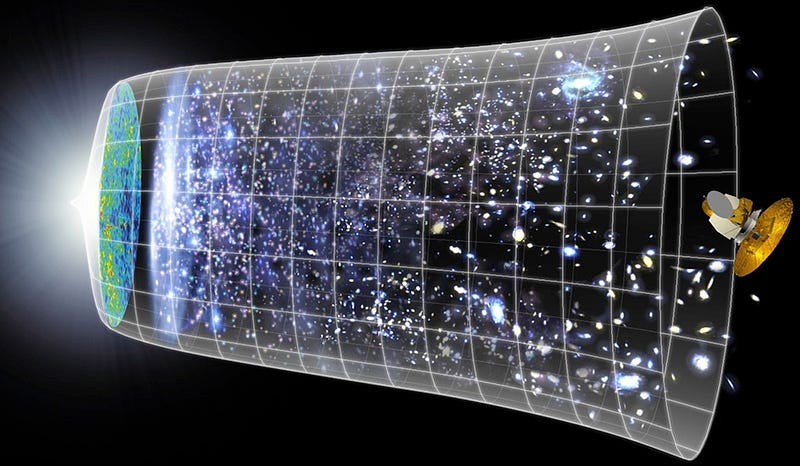
The Universe might be cold and sparse today, with huge distances separating the galaxies and interstellar space cold enough to freeze almost all known substances solid, but it wasn’t always this way. Back when the Universe was younger, it was also hotter and denser, something we can extrapolate back to much greater temperatures than we have today. Hot enough to melt solids, to boil liquids, and even to ionize gases: to strip the atoms themselves of the electrons that bind to them.
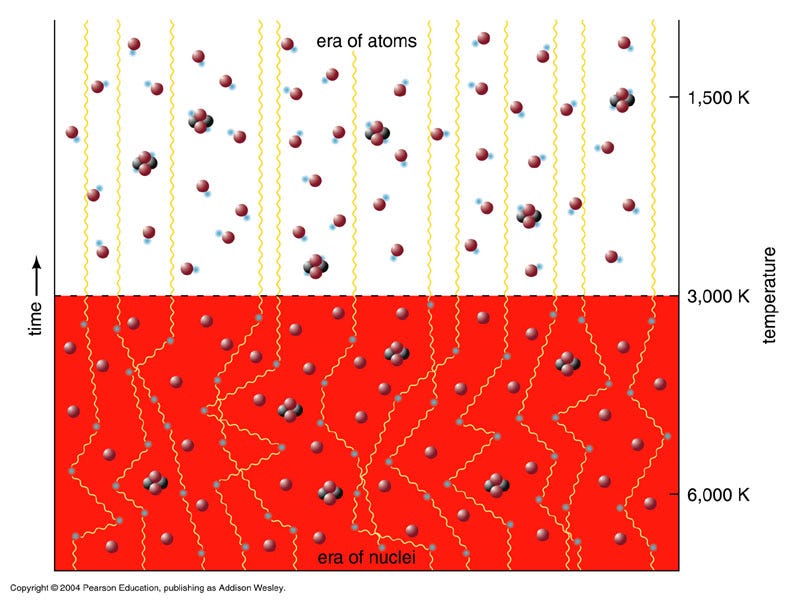
Back when the Universe was too hot to form neutral atoms, photons crashed into the other particles — mostly electrons with the occasional collision with an atomic nucleus — far too frequently for them to travel any appreciable distance. But when the Universe finally became cool enough to allow the formation of neutral atoms, the vast majority of photons will never interact with another atom, nucleus or electron ever again, and will simply stream in a straight line from the electron they last interacted with for all eternity.
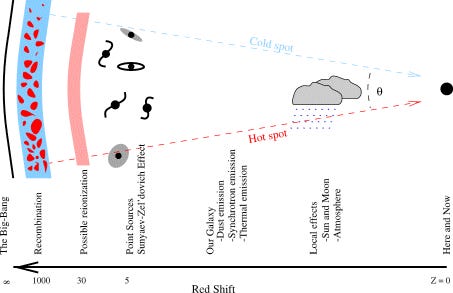
This is quite a prediction, because — since the Universe was in this hot, dense, expanding state everywhere — it means that we should see this radiation coming uniformly from all directions in space! And, because the Universe is no longer just a few hundred thousand years old (which is when this last-scattering occurred), but many billions of years old, this means that the Universe has expanded a tremendous amount.
And as the Universe expands, the wavelength of the photons in it get stretched along with the expansion of spacetime, meaning that this radiation should be very cool: just a few degrees above absolute zero.

So that’s the first prediction of the Big Bang about this radiation: it should be uniform in Temperature, just a few degrees above absolute zero, and should come equally from all directions in space. Additionally, it should also follow a blackbody spectrum, in accordance with the way thermodynamics works in an expanding Universe under the laws of General Relativity.
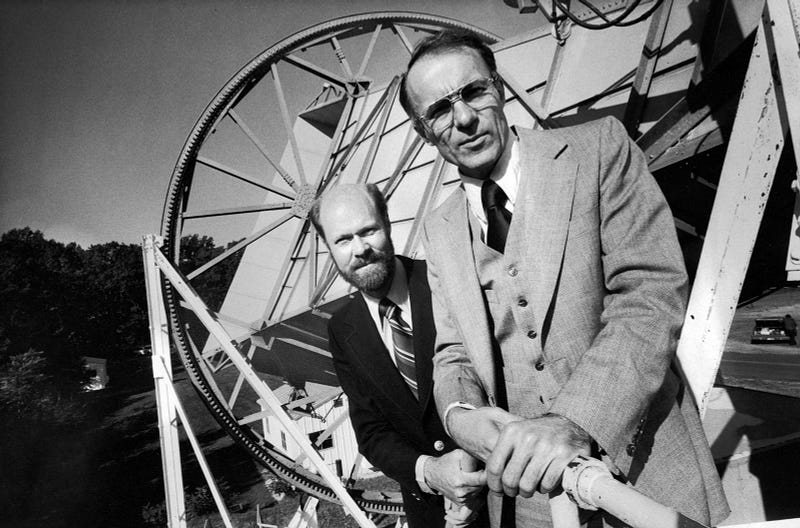
That’s exactly what Arno Penzias and Bob Wilson discovered back in 1965, using the Holmdel Horn Antenna, shown above. They saw a uniform amount of microwave radiation coming from all directions in the sky, hovering right around 3 Kelvin, with no apparent changes in different directions.
It was later confirmed (by the COBE satellite) that the spectrum of these fluctuations did in fact match the blackbody predictions, to unprecedented accuracy!
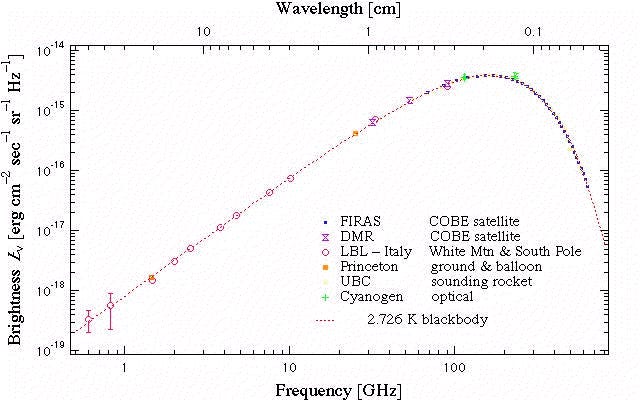
But if everything were perfectly uniform, and there were absolutely no temperature fluctuations, then we never would have formed stars, galaxies, or clusters of galaxies in the Universe. The Universe needs imperfections to serve as the seeds for which — under the influence of gravity and millions (and billions) of years of time — structure on both large and small scales will form.

So it was a little surprising when we measured the temperature to be 3 Kelvin, and didn’t find any fluctuations.
And then we got more accurate, and found it to be 2.7 Kelvin, and still no fluctuations.
And then a little more, and found it to be 2.73 Kelvin, and — again — still no fluctuations.
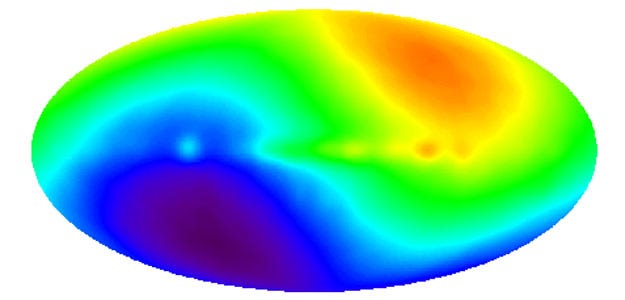
Finally, it was discovered (see here for the history) that one side of the sky is slightly hotter than average by about 3.3 milliKelvin, while the opposite side is slightly colder by the same amount. This tells us that we’re in motion with respect to the rest-frame of the cosmic microwave background by a few hundred kilometers per second, totally in line with what we know about the typical peculiar motions of galaxies in the Universe.
But this isn’t a primordial fluctuation; this is merely an effect of our motion through space! If we want to find a primordial fluctuation, we need to measure things much more accurately, and that means on smaller scales, and down to microKelvin temperature fluctuations. This was done very famously — and very recently — by Planck, to the best precision of all time.
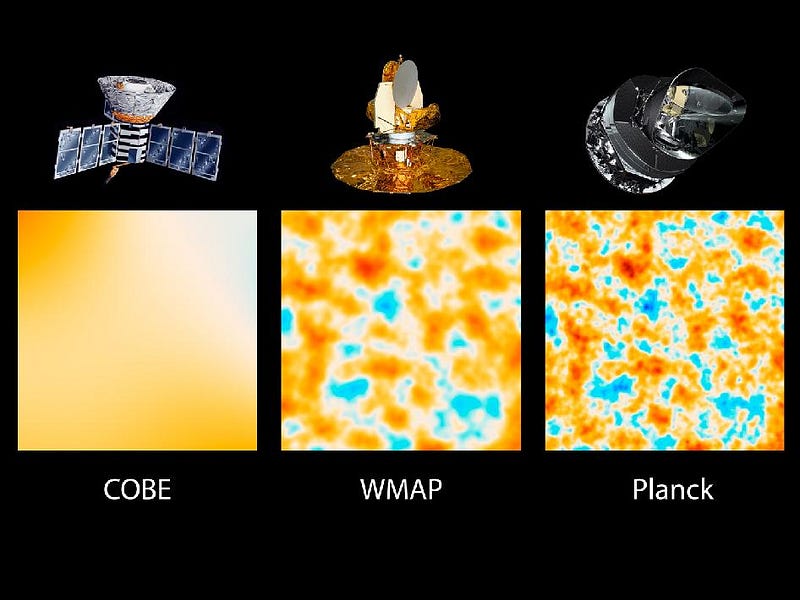
Whereas COBE managed to measure these fluctuations down to a resolution of about 7 degrees, and WMAP managed to go down to about 0.5 degrees, Planck has a resolution better than 0.1 degrees, and can measure temperature fluctuations down to a millionth of a Kelvin. The Planck map of the entire sky looks like this.
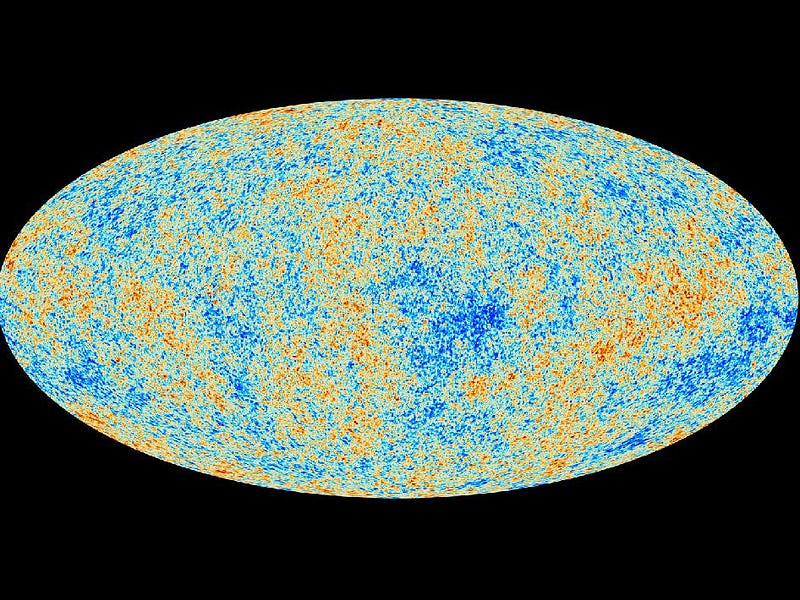
Now, what do we do with a map like this? Well, according to our theory, there are a few ingredients we can put into our Universe to get different patterns of fluctuations out. These ingredients include the following:
- Normal, atomic-based matter,
- Photons,
- Neutrinos,
- Dark Matter,
- Cosmic Strings,
- Domain Walls,
- and a Cosmological Constant, among other possibilities.
The way we figure out what the Universe is made out of is that, on different angular scales, the Universe should exhibit different magnitudes and distributions of fluctuations. We break the sky up in different ways — into smaller and smaller chunks — to measure these fluctuations.
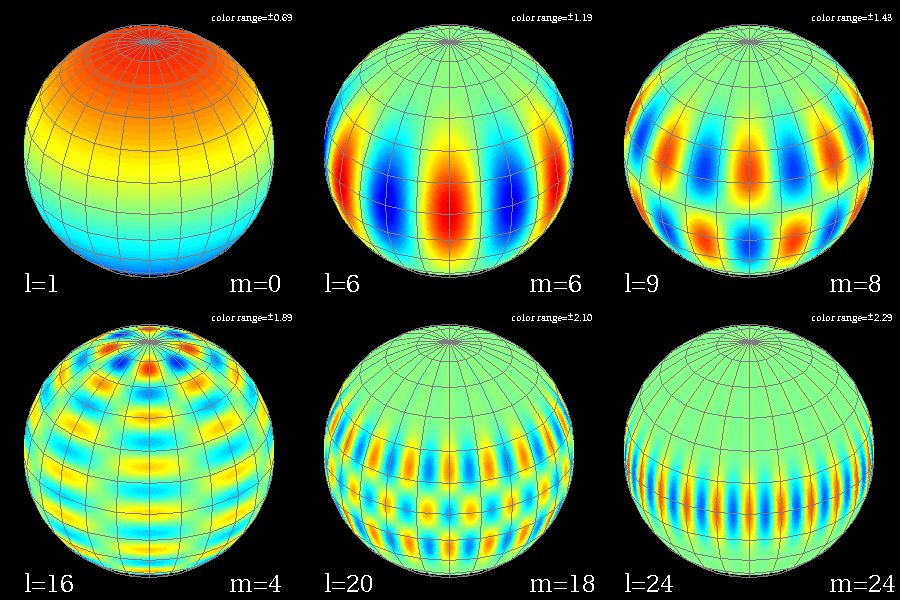
So you compare the measured temperature breakdown of the sky on each of these different scales, and you can find the average amplitude of temperature fluctuations on each angular scale. For Planck, we can go all the way up to about l=2500 and still have reliable results. The best-fit curve to the data is shown below.
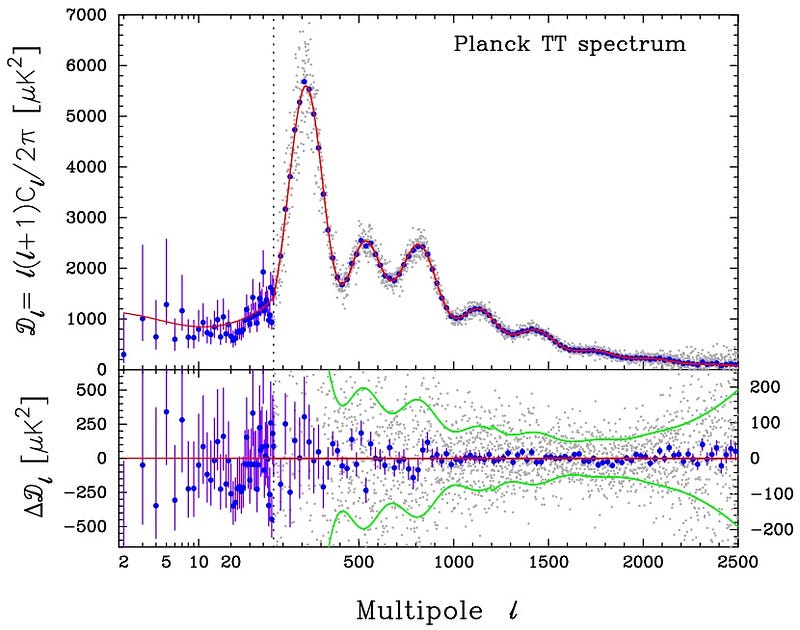
“But it doesn’t match the theory (red line) exactly,” you exclaim!
That’s true, but is that bad? As you can see, the low multipoles (or large angular scales) don’t fit the curve very well, but have very large error bars.
This is normal. In fact, there was an entire blog collective named after this phenomenon: cosmic variance. That curve, above, is what you’d get if you averaged together a large amount of data. But — for the large angles — that would require a large number of Universes, and we can only see one. For example, the l=2 point only averages 5 measurements! So — and remember, statistically, there’s only a 68% chance that a given measurement will lie within one standard deviation of the mean — it’s pretty likely that we’re going to be off in many of the points at the low end, and that’s what we’ve always seen.
But that best-fit curve tells us that the Universe appears to be made of:
- about 4.9% normal, atomic-based matter,
- about 0.01% photons,
- around 0.1% neutrinos,
- about 26.3% dark matter,
- no cosmic strings,
- no domain walls,
- and 68.7% cosmological constant, with no evidence for dark energy being anything more exotic than this.
Which is in fantastic agreement with all other observations. What about the anomalies in the CMB?
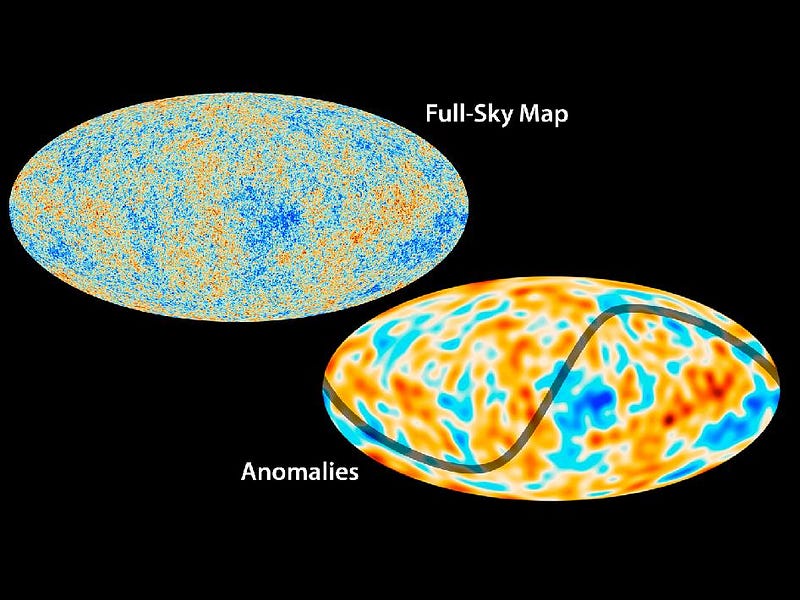
Worried that there are “anomalies” at all when it comes to the expected behavior of the Universe? Maybe you shouldn’t be.
Yes, there appears to be some “extra” stuff that’s not on the line predicted by the best-fit parameters to our theory. In other words, these are the locations where — if we subtract out the expected fluctuations from the expected best-fit — there’s a little bit of extra (or too little) power, or temperature fluctuations that are a little too big or a little too small.
If you show them on the “anomalies” chart, above, they look pretty menacing. And no doubt, there may be new physics there. But I can show this to you in a different way.
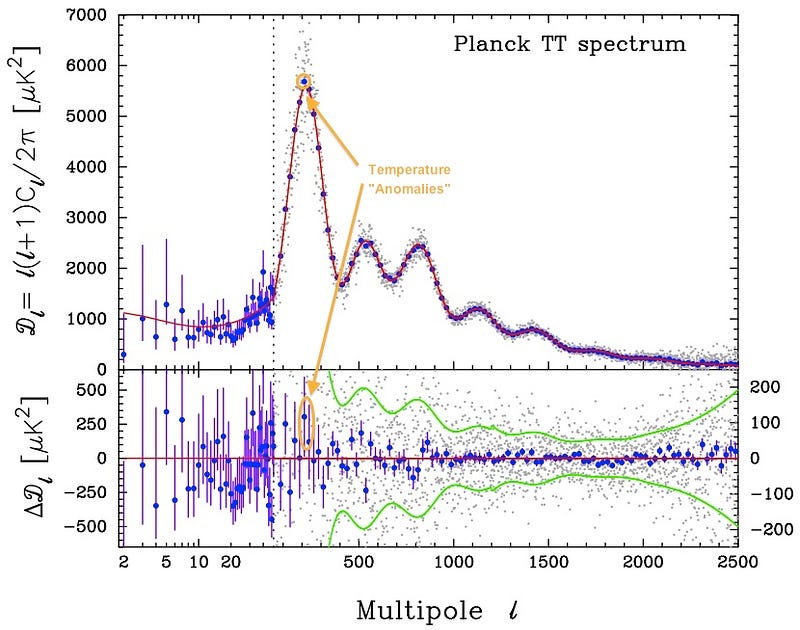
Other than the largest scales I already talked about, these are the temperature anomalies. That’s right, the amount that that one binned data point is “off” from the predicted line represents practically the entirety of the “anomaly.”
The odds that the Universe would have that particular anomaly? Small; less than 1%.
But is that something we should worry about when it comes to our Universe? Or is that just an unlikely effect that shows up every once-in-a-while because we’re looking for “anomalies” in the data of so many different components of a large set?

If you remember your statistics, we normally require a much higher standard to deem something of importance: 5-σ statistical significance; this effect is around 3-σ. It could be interesting, but it could also just be the Universe we have. It’s important to probe potential cracks in the theory; that’s often where the greatest progress can be made. But don’t you dare understate the successes of the current cosmological model; remember how mind-bogglingly hard we’ve had to look to find any departures at all from what was expected! The Universe is what we thought it was, and from where cosmology sits today, our current understanding of it — including all the data from the CMB — looks pretty damned good!
Leave your comments on our forum, and support Starts With A Bang on Patreon!


