Infrared, visible, and ultraviolet combine to show us Jupiter’s features as never before.
The largest planet in our Solar System, Jupiter, is our own ‘failed star.’
The best evidence-based classification scheme of planets is to categorize them as either rocky, Neptune-like, Jupiter-like or stellar-like. Jupiter is the only planet in our Solar System to have crossed the mass threshold to begin to experience self-compression, but is a long way off from initiating fusion to become a true star. (CHEN AND KIPPING, 2016, VIA HTTPS://ARXIV.ORG/PDF/1603.08614V2.PDF)
Although it gravitationally undergoes self-compression, it’s too light to initiate nuclear fusion.
This cutaway of Jupiter showcases a number of its layers. In the interior, Jupiter is the hottest location in the Solar System outside of the Sun’s interior or corona, with temperatures of tens of thousands of degrees. However, the tops of its atmosphere are extremely cold, at negative hundreds of degrees. (WIKIMEDIA COMMONS USER KELVINSONG)
Jupiter’s enormous core temperatures — 24,000 °C (43,000 °F) — contrast with its icy cloud-tops: -145 °C (-234 °F).
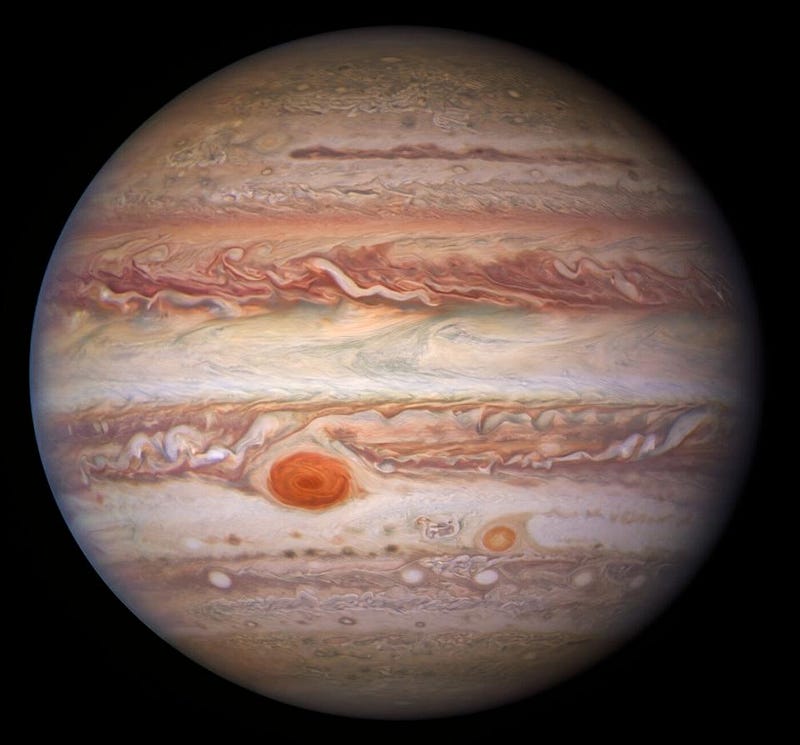
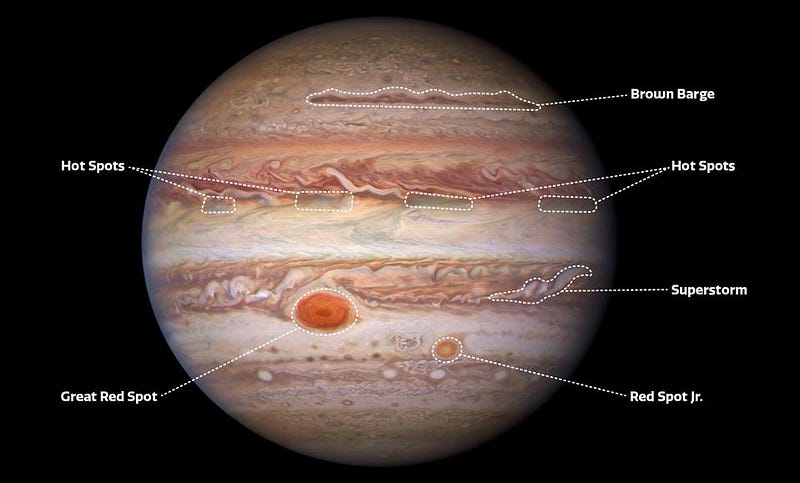
This visible-light image of Jupiter was created from data captured on 11 January 2017 using the Wide Field Camera 3 on the Hubble Space Telescope. Near the top, a long brown feature called a ‘brown barge’ extends 72,000 kilometers (nearly 45,000 miles) in the east-west direction. The Great Red Spot stands out prominently in the lower left, while the smaller feature nicknamed Red Spot Jr. (known to Jovian scientists as Oval BA) appears to its lower right. (NASA/ESA/NOIRLAB/NSF/AURA/M.H. WONG AND I. DE PATER (UC BERKELEY) ET AL.; ACKNOWLEDGMENTS: M. ZAMANI)
The familiar bands, spots, and turbulence are superficial, optical features.
The first color movie of Jupiter from NASA’s Cassini spacecraft shows what it would look like to peel the entire globe of Jupiter, stretch it out on a wall into the form of a rectangular map, and watch its atmosphere evolve with time. The familiar bands, turbulent features, and red (and white) spots can all be seen, but these are merely the topmost features. (NASA/JPL/UNIVERSITY OF ARIZONA)
However, other wavelengths can reveal processes beneath Jupiter’s clouds.
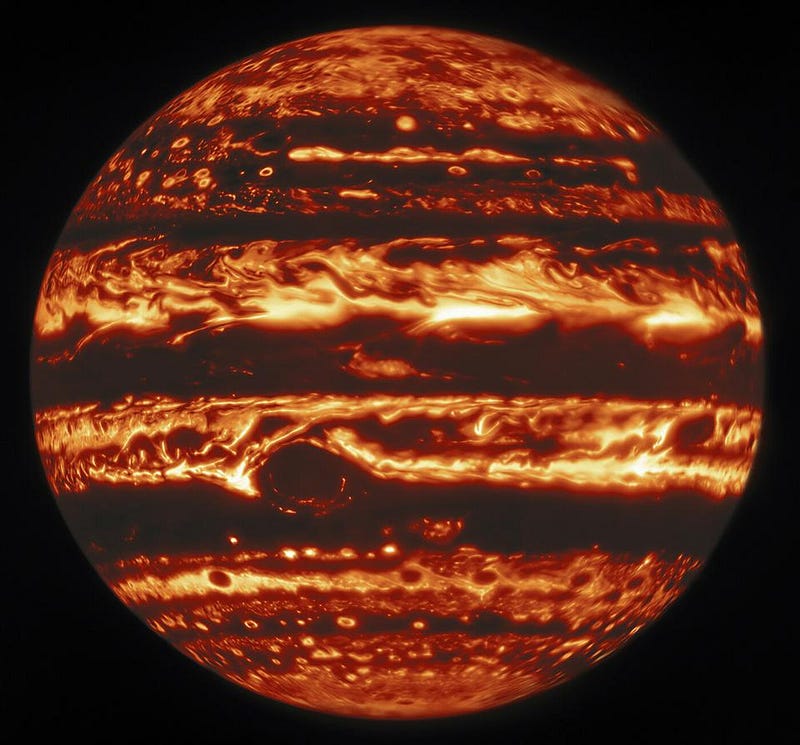
This infrared view of Jupiter was created from data captured on 11 January 2017 with the Near-InfraRed Imager (NIRI) instrument at Gemini North in Hawaiʻi, the northern member of the international Gemini Observatory, a Program of NSF’s NOIRLab. It is actually a mosaic of individual frames that were combined to produce a global portrait of the planet. In the image warmer areas appear bright, including four large hot spots that appear in a row just north of the equator. South of the equator, the oval-shaped and cloud-covered Great Red Spot appears dark. (INTERNATIONAL GEMINI OBSERVATORY/NOIRLAB/NSF/AURA, M.H. WONG (UC BERKELEY) ET AL.; ACKNOWLEDGMENTS: M. ZAMANI)
Infrared light showcases the thickness of the clouds, planet-wide.
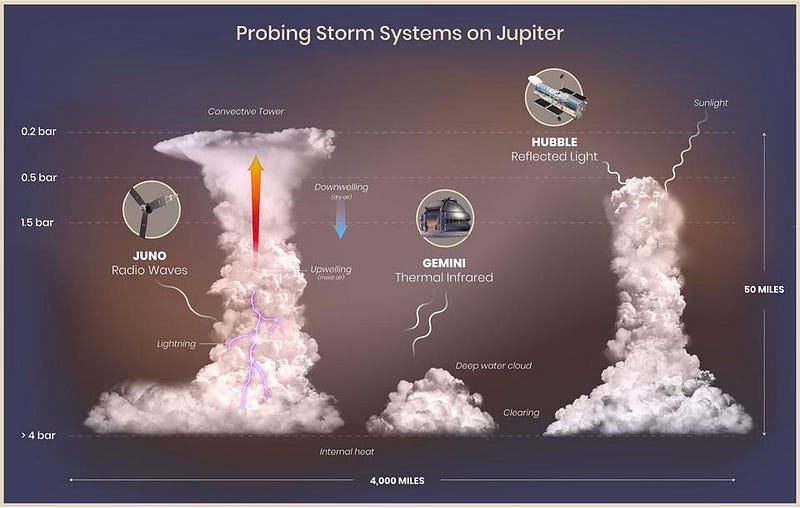
This illustration of lightning, convective towers (thunderheads), deep water clouds, and clearings in Jupiter’s atmosphere is based on data collected by the Juno spacecraft, the Hubble Space Telescope, and the international Gemini Observatory. The presence, absence and strength of the thermal, infrared radiation reveals the thickness of the cloud-decks over any region on Jupiter. (NASA, ESA, M.H. WONG (UC BERKELEY), AND A. JAMES AND M.W. CARRUTHERS (STSCI))
The strongest infrared signals indicate the thinnest clouds, allowing warmer, deeper Jovian regions to shine.
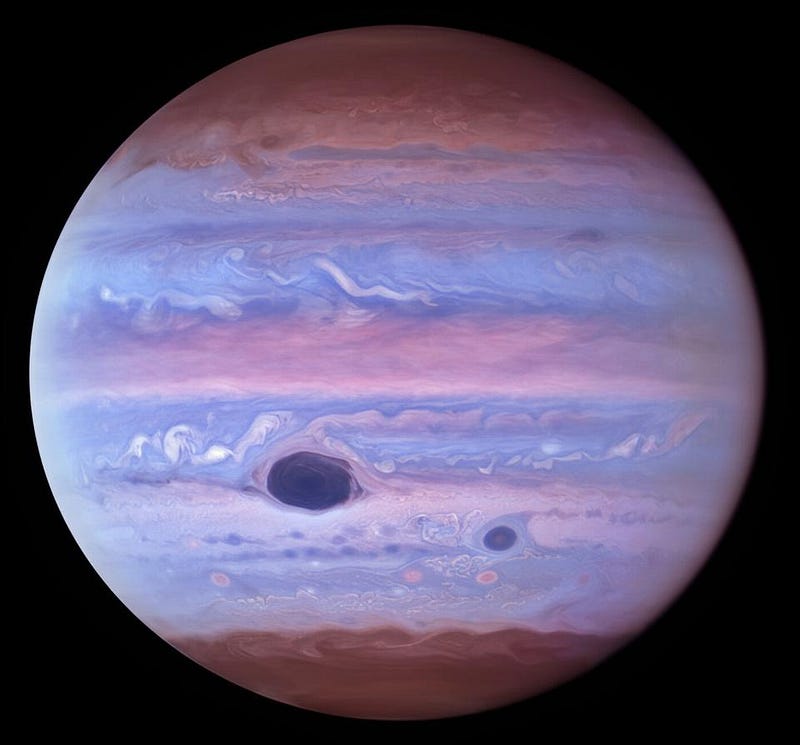
This ultraviolet image of Jupiter was created from data captured on 11 January 2017 using the Wide Field Camera 3 on the Hubble Space Telescope. The Great Red Spot and Red Spot Jr. (also known as Oval BA) absorb ultraviolet radiation from the Sun and therefore appear dark in this view. (NASA/ESA/NOIRLAB/NSF/AURA/M.H. WONG AND I. DE PATER (UC BERKELEY) ET AL.; ACKNOWLEDGMENTS: M. ZAMANI)
Meanwhile, ultraviolet light gets absorbed by chromophore particles, absent in white spots but present in red ones.
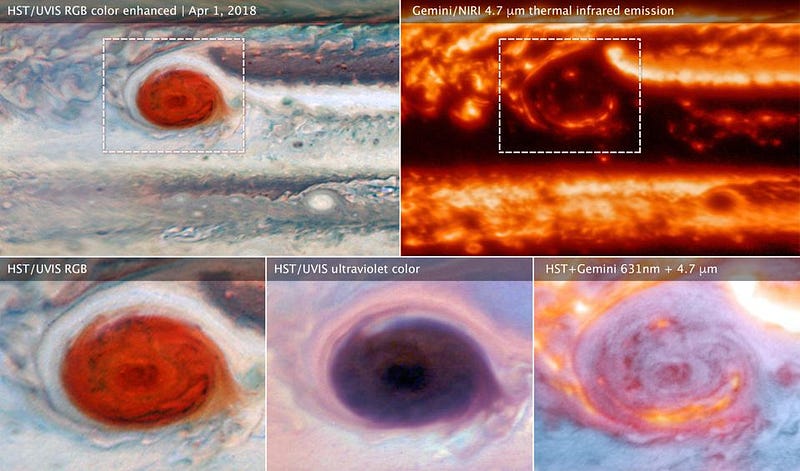
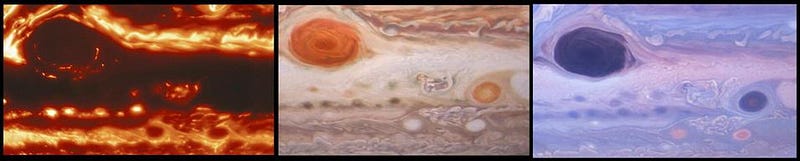
Great Red Spot in a variety of visible, infrared, and ultraviolet wavelengths and composites. Clockwise from top left: Hubble image of visible spectrum; infrared from the Gemini Observatory; multiwavelength composite of Hubble and Gemini data showing visible light in blue and thermal infrared in red; ultraviolet image from Hubble; visible light detail. Note the enormous variety of appearances of the Great Red Spot in a variety of wavelengths. (NASA, ESA, AND M.H. WONG (UC BERKELEY) AND TEAM)
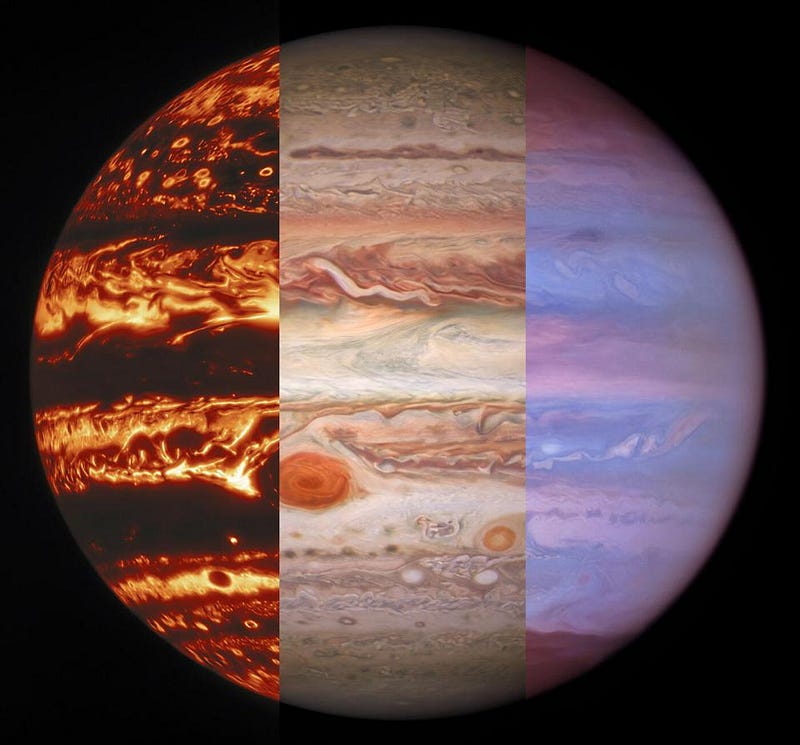
This composite image of Jupiter has been edited to show three separate wavelengths at once. At left, the infrared view of the planet from Gemini North appears. In the center, the features seen in visible light are present. And at right, the Hubble Space Telescope’s ultraviolet view comes out. All three images were taken simultaneously on January 11, 2017. (INTERNATIONAL GEMINI OBSERVATORY/NOIRLAB/NSF/AURA, M.H. WONG (UC BERKELEY) ET AL.; ACKNOWLEDGMENTS: M. ZAMANI; EDITS: E. SIEGEL)
This triple view of Jupiter showcases the dark infrared regions and how they correspond to thick clouds (visible) and the painted-like features (ultraviolet) of Jupiter in other wavelengths. The Great Red Spot, in particular, has a fascinating structure that appears vastly different in these different wavelengths. (INTERNATIONAL GEMINI OBSERVATORY/NOIRLAB/NSF/AURA, M.H. WONG (UC BERKELEY) ET AL.; ACKNOWLEDGMENTS: M. ZAMANI; EDITS: E. SIEGEL)
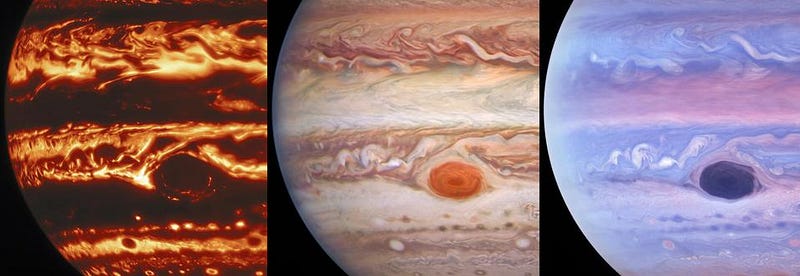
The Great Red Spot (L) and Red Spot Jr. (R), along with two white storms (bottom) on Jupiter. Note how vastly different the regions look in infrared (left) versus visible or ultraviolet, as well as how the tiny bright ‘dots’ in the infrared indicate gaps in the clouds, which are evidence of convection in Jupiter’s upper atmosphere. (INTERNATIONAL GEMINI OBSERVATORY/NOIRLAB/NSF/AURA, M.H. WONG (UC BERKELEY) ET AL.; ACKNOWLEDGMENTS: M. ZAMANI; EDITS: E. SIEGEL)
However, tiny infrared “dots” indicate downdrafts, creating convection and enabling Jovian lightning storms.
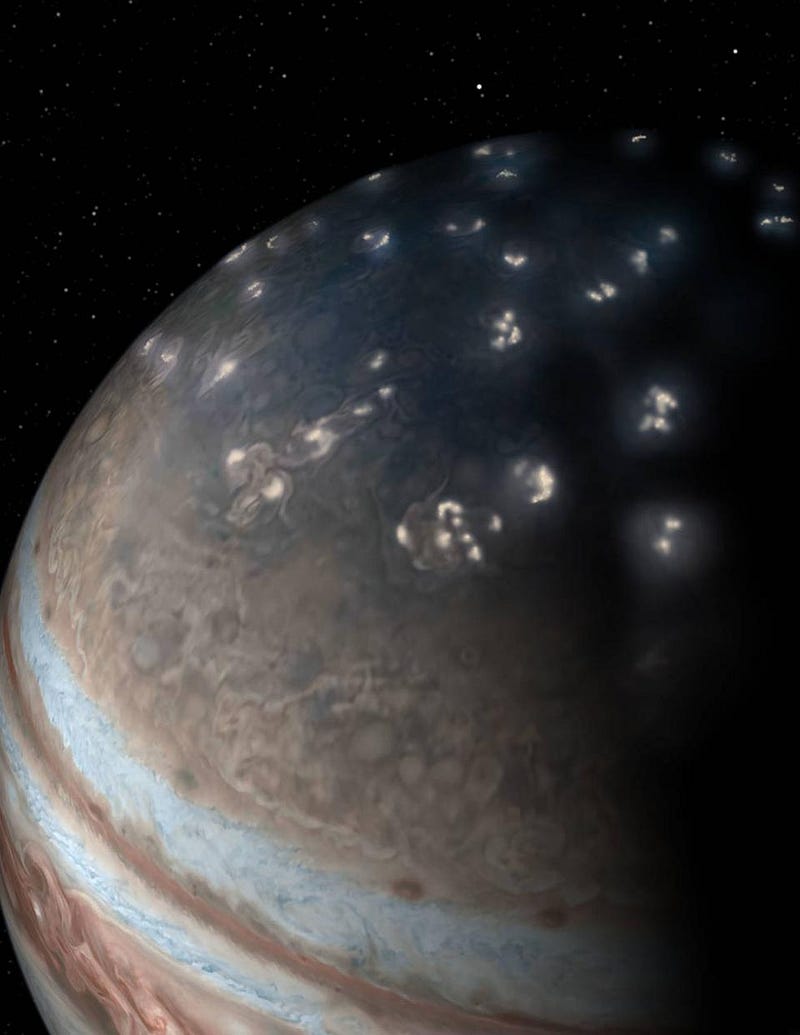
This artist’s concept of lightning distribution in Jupiter’s northern hemisphere incorporates a JunoCam image with artistic embellishments. Data from NASA’s Juno mission indicates that most of the lightning activity on Jupiter is near its poles. Juno’s capabilities of observing radio signals enable us to track lightning strikes, a further complement to these recent multiwavelength studies. (NASA/JPL-CALTECH/SWRI/JUNOCAM)
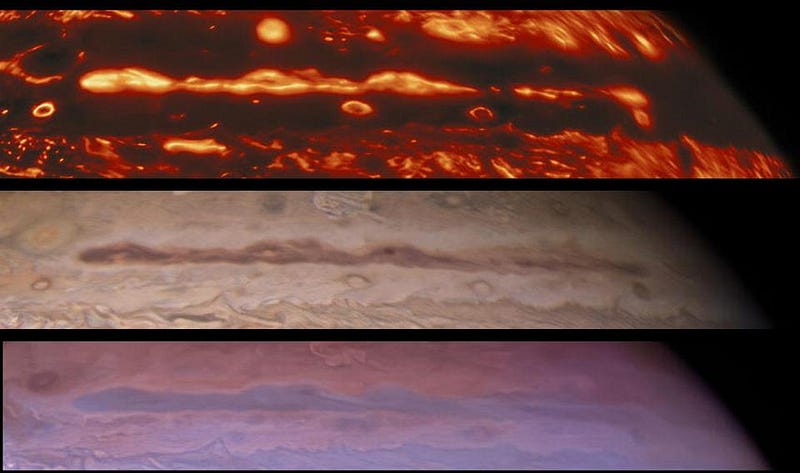
Multiwavelength view of the so-called ‘brown barge’ in Jupiter’s northern hemisphere. In visible light, it just looks like a dark streak, but infrared emission reveals that this is actually a ‘break’ in the clouds of Jupiter. The ring-like features are also evidence of cloud breaks and hot spots, which are barely visible in ultraviolet light at all. (INTERNATIONAL GEMINI OBSERVATORY/NOIRLAB/NSF/AURA, M.H. WONG (UC BERKELEY) ET AL.; ACKNOWLEDGMENTS: M. ZAMANI; EDITS: E. SIEGEL)
The atmosphere is thinnest just above the equator, excepting a snake-like streak of thick, opaque clouds.
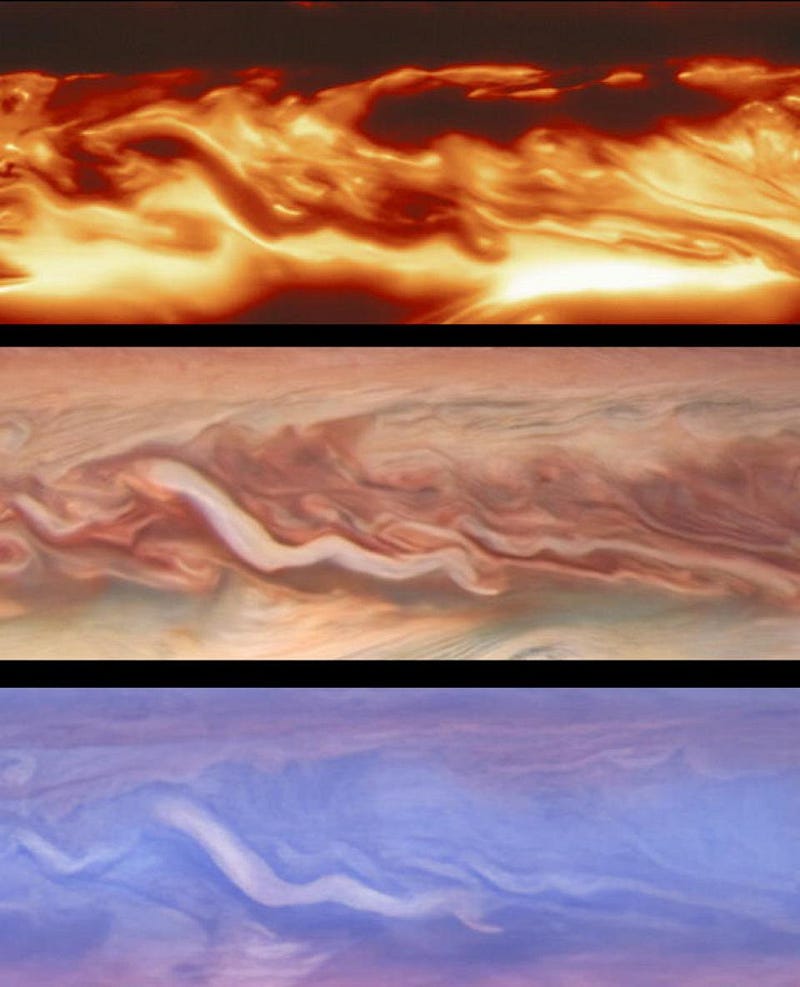
A three-panel view of the ‘snake’ on Jupiter: a high-topped, thick cloud. In infrared, it appears dark and opaque, as it prevents the heat from Jupiter’s lower layers from getting through. In visible and ultraviolet light, however, it appears bright and reflective. (INTERNATIONAL GEMINI OBSERVATORY/NOIRLAB/NSF/AURA, M.H. WONG (UC BERKELEY) ET AL.; ACKNOWLEDGMENTS: M. ZAMANI; EDITS: E. SIEGEL)
Labels added to this visible-light Hubble Space Telescope image of Jupiter point out several atmospheric features on the planet, including a ‘brown barge’, four hot spots (which appear bright in the infrared image from Gemini North), a superstorm, the Great Red Spot, and Red Spot Jr. (also known as Oval BA). (NASA/ESA/NOIRLAB/NSF/AURA/M.H. WONG AND I. DE PATER (UC BERKELEY) ET AL.)
Combined with NASA’s Juno mission, scientists hope to explain Jupiter’s evolving Great Red Spot.
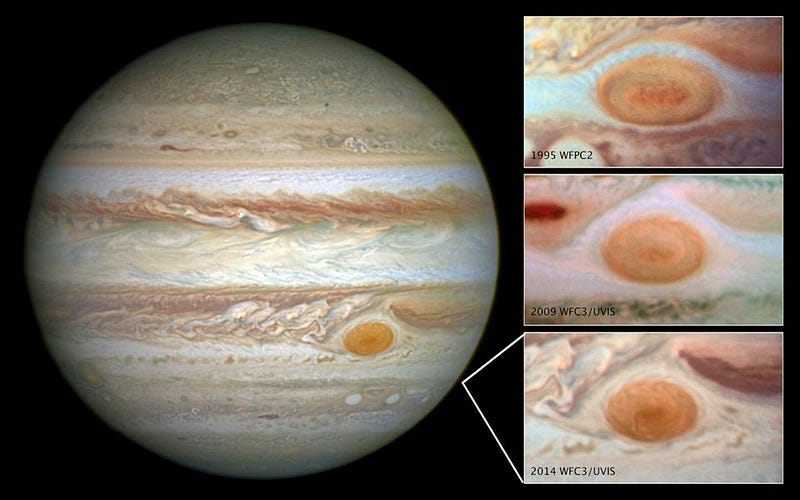
Jupiter’s Great Red Spot has changed in size and color frequently over the centuries. While it’s been a fixture of Jupiter since it was first observed in the 1600s, the Great Red Spot is a large but likely temporary storm, and multiwavelength observations are key to better understanding its nature and evolution. (NASA, ESA, AND A. SIMON (GODDARD SPACE FLIGHT CENTER))
Mostly Mute Monday tells an astronomical story in images, visuals, and no more than 200 words. Talk less; smile more.