Sign up for Big Think on Substack
The most surprising and impactful new stories delivered to your inbox every week, for free.
Gross Domestic Product (GDP) is a convenient way of measuring and comparing the size of national economies. Annual GDP represents the market value of all goods and services produced within a country in a year. Put differently:
GDP = consumption + investment + government spending + (exports – imports)
Although the economies of countries like China and India are growing at an incredible rate, the US remains the nation with the highest GDP in the world – and by far: US GDP was projected to be $13,22 trillion (or $13.220 billion) in 2007, according to this source. That’s almost as much as the economies of the next four (Japan, Germany, China, UK) combined.
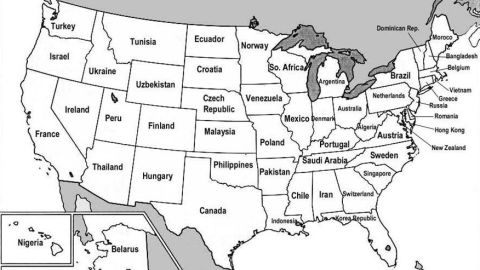
The creator of this map has had the interesting idea to break down that gigantic US GDP into the GDPs of individual states, and compare those to other countries’ GDP. What follows, is this slightly misleading map – misleading, because the economies both of the US states and of the countries they are compared with are not weighted for their respective populations.
Pakistan, for example, has a GDP that’s slightly higher than Israel’s – but Pakistan has a population of about 170 million, while Israel is only 7 million people strong. The US states those economies are compared with (Arkansas and Oregon, respectively) are much closer to each other in population: 2,7 million and 3,4 million.
And yet, wile a per capita GDP might give a good indication of the average wealth of citizens, a ranking of the economies on this map does serve two interesting purposes: it shows the size of US states’ economies relative to each other (California is the biggest, Wyoming the smallest), and it links those sizes with foreign economies (which are therefore also ranked: Mexico’s and Russia’s economies are about equal size, Ireland’s is twice as big as New Zealand’s). Here’s a run-down of the 50 states, plus DC:
California, it is often said, would be the world’s sixth- or seventh-largest economy if it were a separate country. Actually, that would be the eighth, according to this map, as France (with a GDP of $2,15 trillion) is #8 on the aforementioned list.
Texas’ economy is significantly smaller, exactly half of California’s, as its GDP compares to that of Canada (#10, $1,08 trillion).
Florida also does well, with its GDP comparable to Asian tiger South Korea’s (#13 at $786 billion).
Illinois – Mexico (GDP #14 at $741 billion)
New Jersey – Russia (GDP #15 at $733 billion)
Ohio – Australia (GDP #16 at $645 billion)
New York – Brazil (GDP #17 at $621 billion)
Pennsylvania – Netherlands (GDP #18 at $613 billion)
Georgia – Switzerland (GDP #19 at $387 billion)
North Carolina – Sweden (GDP #20 at $371 billion)
Massachusetts – Belgium (GDP #21 at $368 billion)
Washington – Turkey (GDP #22 at $358 billion)
Virginia – Austria (GDP #24 at $309 billion)
Tennessee – Saudi Arabia (GDP #25 at $286 billion)
Missouri – Poland (GDP #26 at $265 billion)
Louisiana – Indonesia (GDP #27 at $264 billion)
Minnesota – Norway (GDP #28 at $262 billion)
Indiana – Denmark (GDP #29 at $256 billion)
Connecticut – Greece (GDP #30 at $222 billion)
Michigan – Argentina (GDP #31 at $210 billion)
Nevada – Ireland (GDP #32 at $203 billion)
Wisconsin – South Africa (GDP #33 at $200 billion)
Arizona – Thailand (GDP #34 at $197 billion)
Colorado – Finland (GDP #35 at $196 billion)
Alabama – Iran (GDP #36 at $195 billion)
Maryland – Hong Kong (#37 at $187 billion GDP)
Kentucky – Portugal (GDP #38 at $177 billion)
Iowa – Venezuela (GDP #39 at $148 billion)
Kansas – Malaysia (GDP #40 at $132 billion)
Arkansas – Pakistan (GDP #41 at $124 billion)
Oregon – Israel (GDP #42 at $122 billion)
South Carolina – Singapore (GDP #43 at $121 billion)
Nebraska – Czech Republic (GDP #44 at $119 billion)
New Mexico – Hungary (GDP #45 at $113 billion)
Mississippi – Chile (GDP #48 at $100 billion)
DC – New Zealand (#49 at $99 billion GDP)
Oklahoma – Philippines (GDP #50 at $98 billion)
West Virginia – Algeria (GDP #51 at $92 billion)
Hawaii – Nigeria (GDP #53 at $83 billion)
Idaho – Ukraine (GDP #54 at $81 billion)
Delaware – Romania (#55 at $79 billion GDP)
Utah – Peru (GDP #56 at $76 billion)
New Hampshire – Bangladesh (GDP #57 at $69 billion)
Maine – Morocco (GDP #59 at $57 billion)
Rhode Island – Vietnam (GDP #61 at $48 billion)
South Dakota – Croatia (GDP #66 at $37 billion)
Montana – Tunisia (GDP #69 at $33 billion)
North Dakota – Ecuador (GDP #70 at $32 billion)
Alaska – Belarus (GDP #73 at $29 billion)
Vermont – Dominican Republic (GDP #81 at $20 billion)
Wyoming – Uzbekistan (GDP #101 at $11 billion)
This map was suggested by Morgan via strangemaps@gmail.com, and can be found here. Please note that the GDP data used for this comparison are not necessarily the same as those used in compiling the original map.
Update: Strange Maps is happy finally to be able to give credit where it is due. As was pointed out to us, this iconic map was conceived by Earl Fry, professor of political science at Brigham Young University, for the Globe and Mail in Toronto. Prof. Fry has since produced a number of updated versions of this map for the Canadian newspaper.
Sign up for Big Think on Substack
The most surprising and impactful new stories delivered to your inbox every week, for free.


