Electricity generation by U.S. state
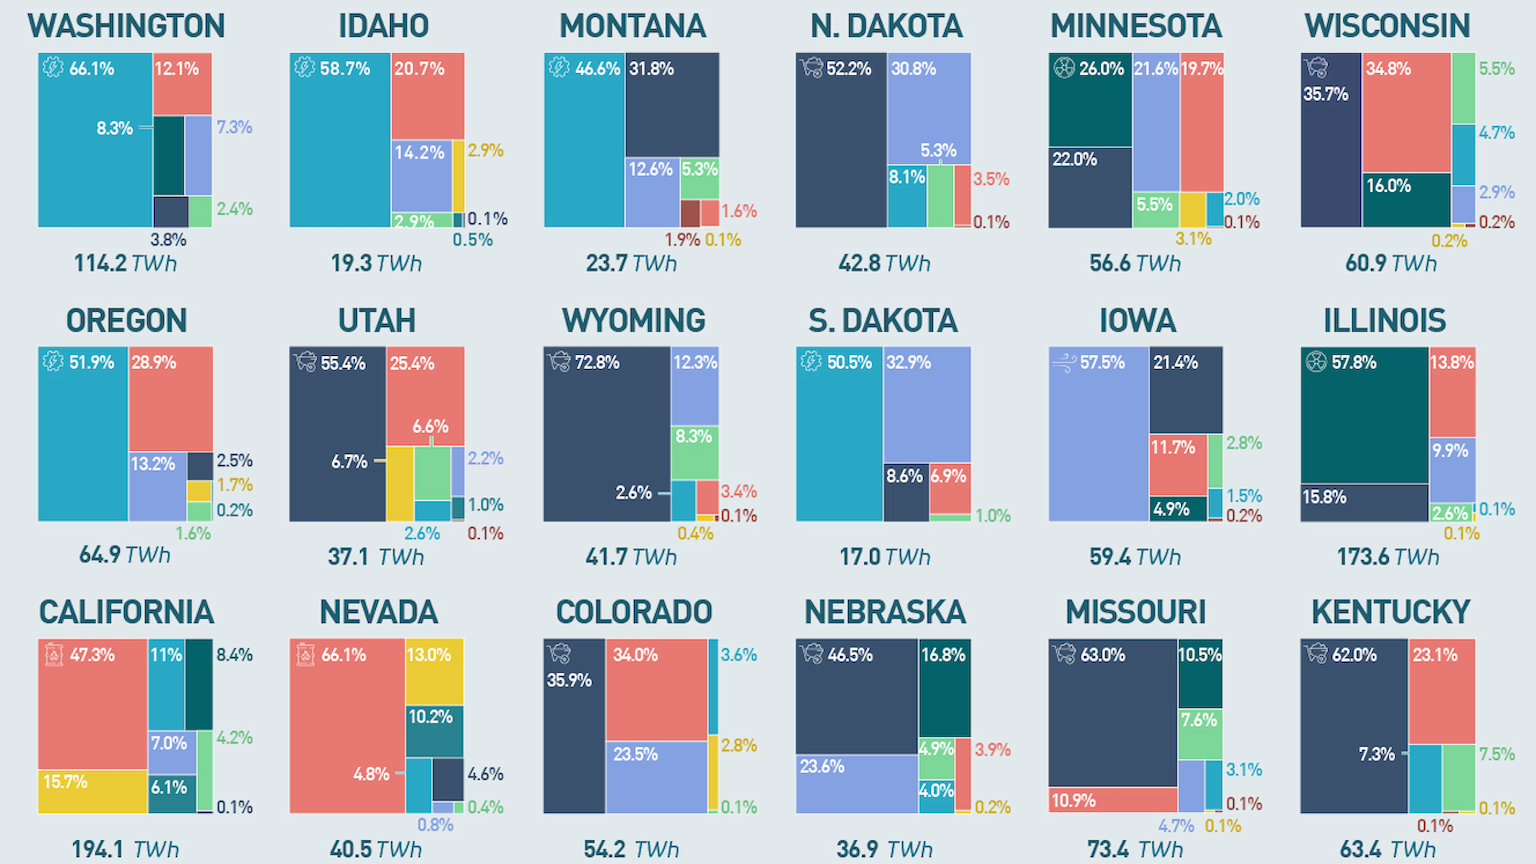
- The U.S. gets 60 percent of its electricity from fossil fuels, but plans are afoot to drastically reduce that share.
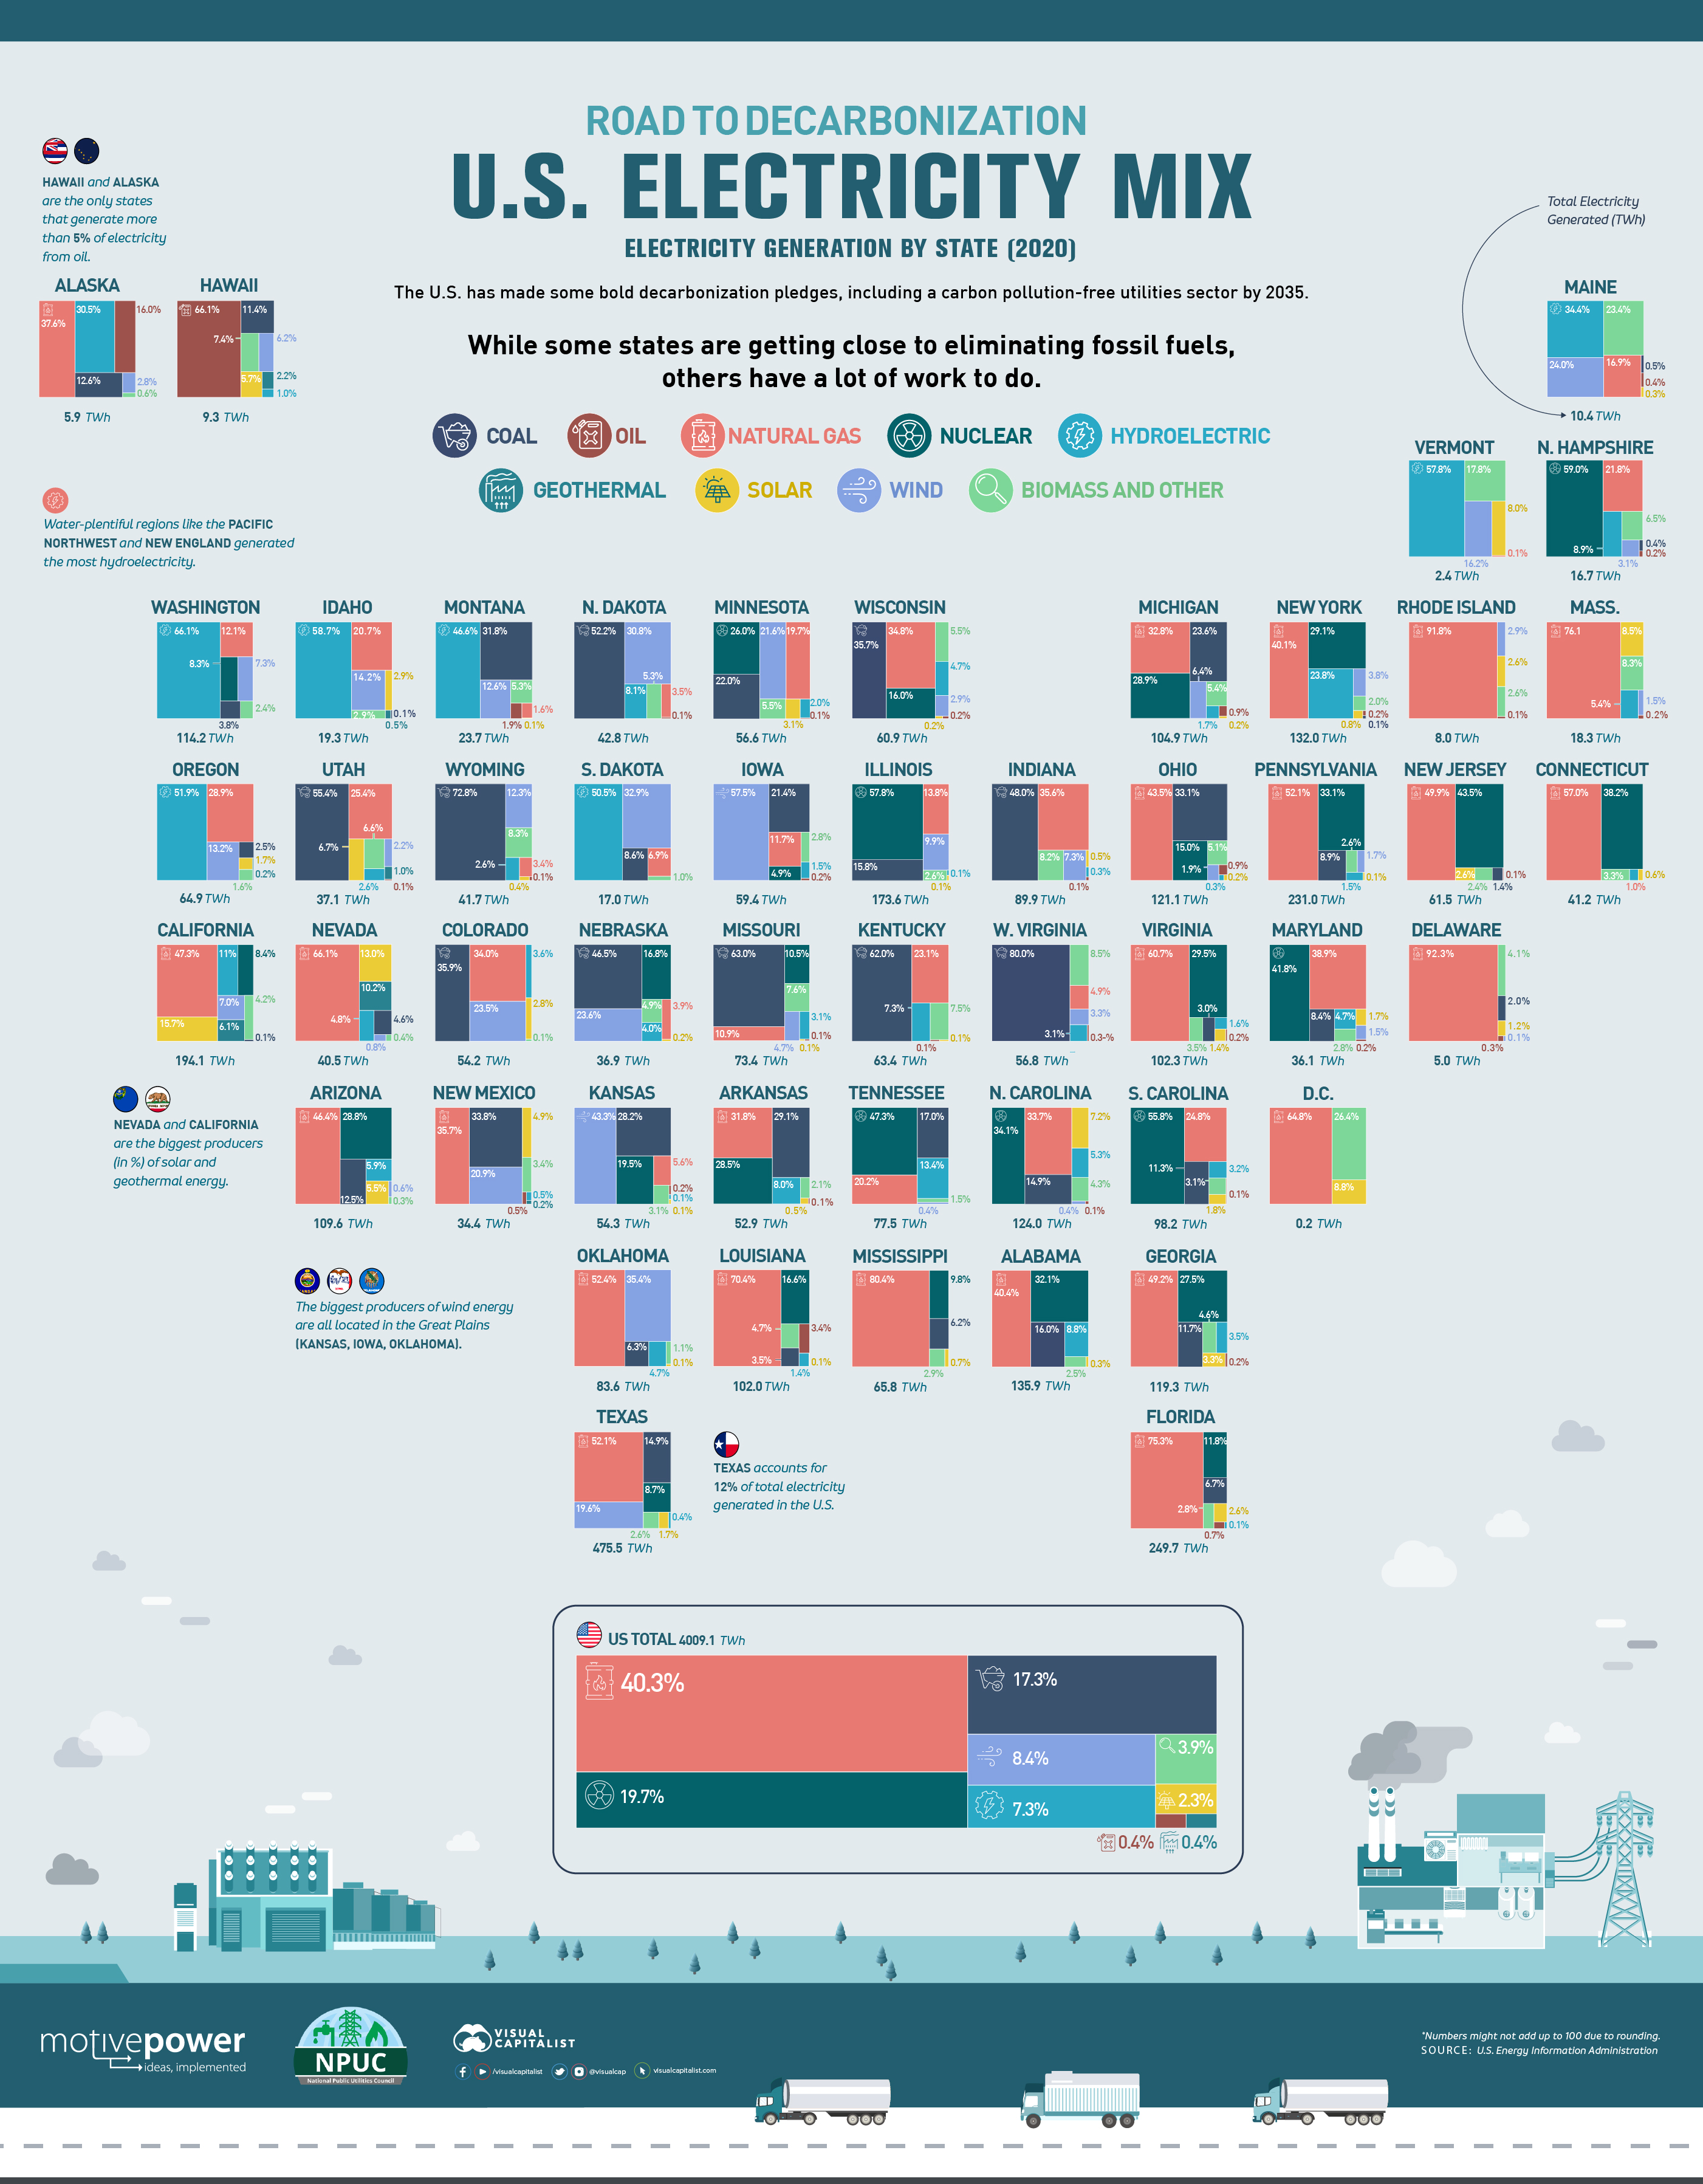
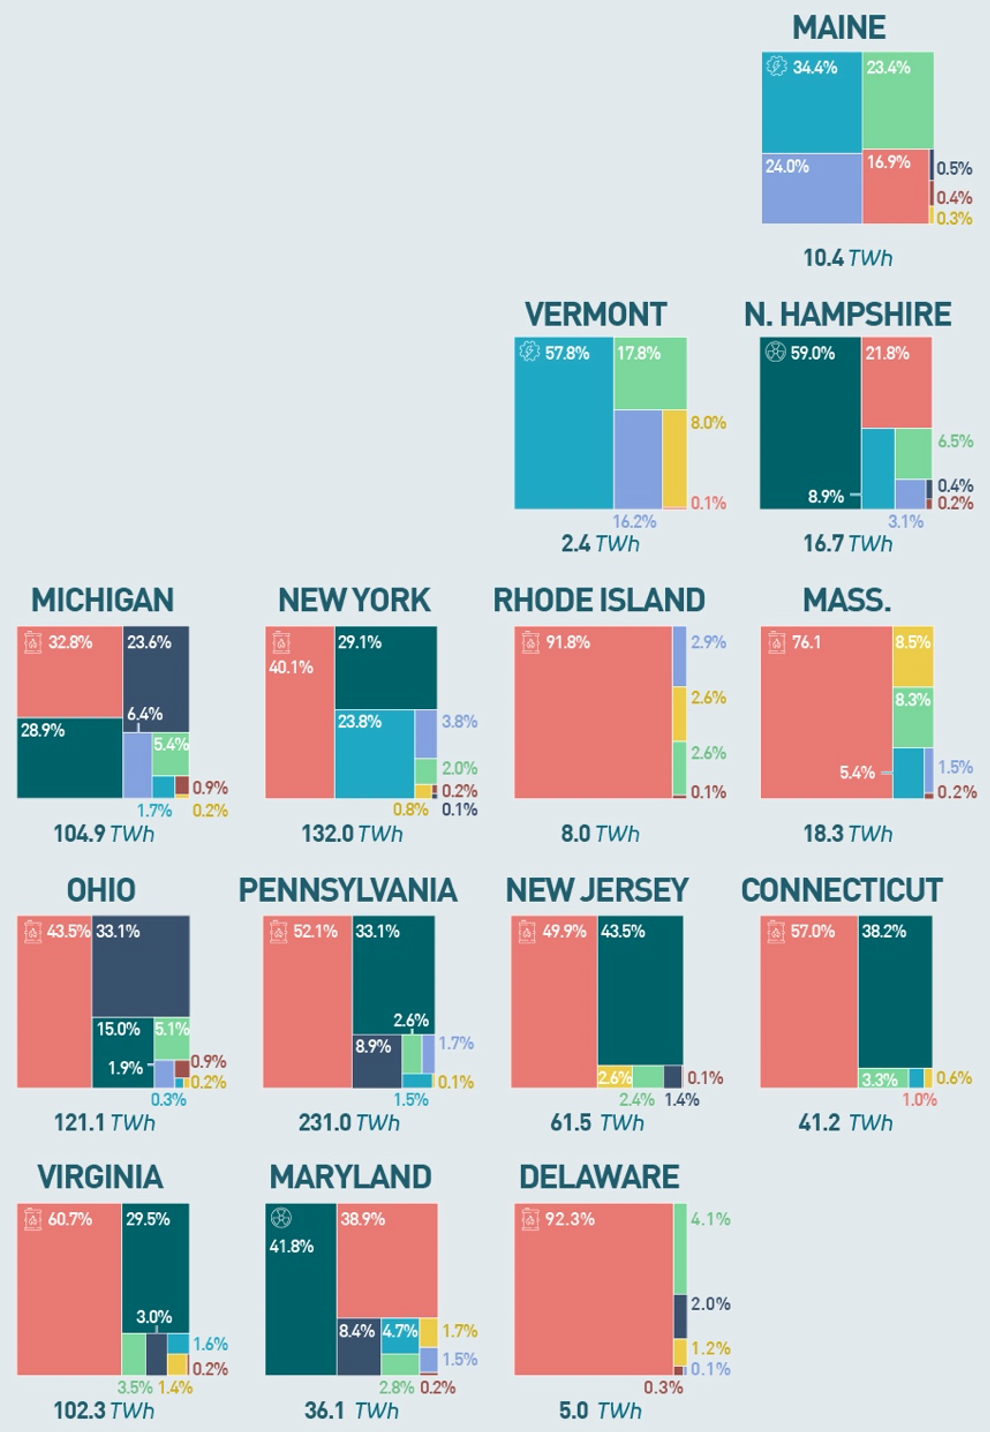
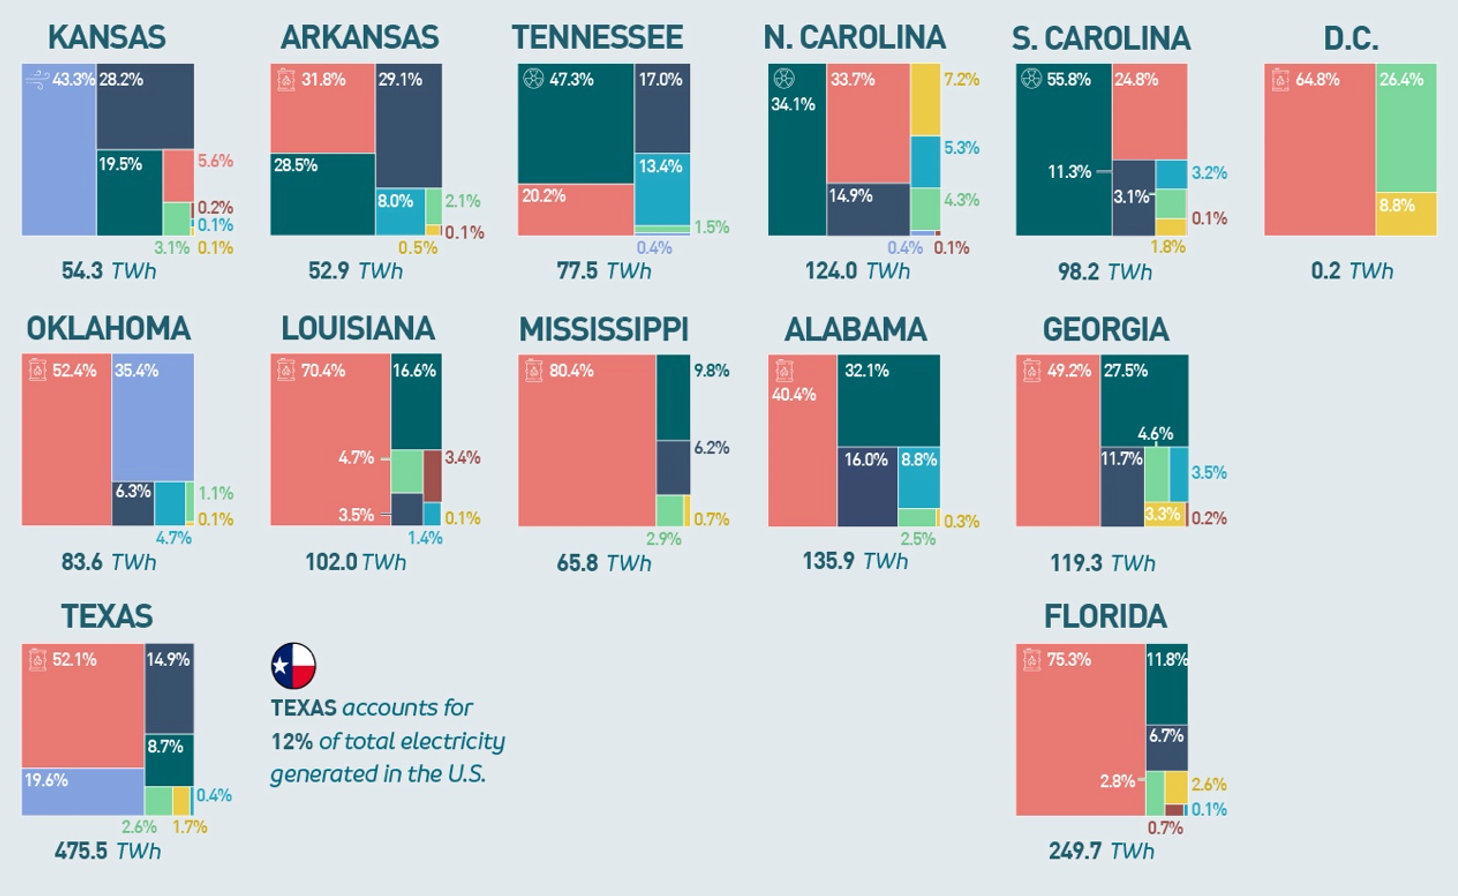
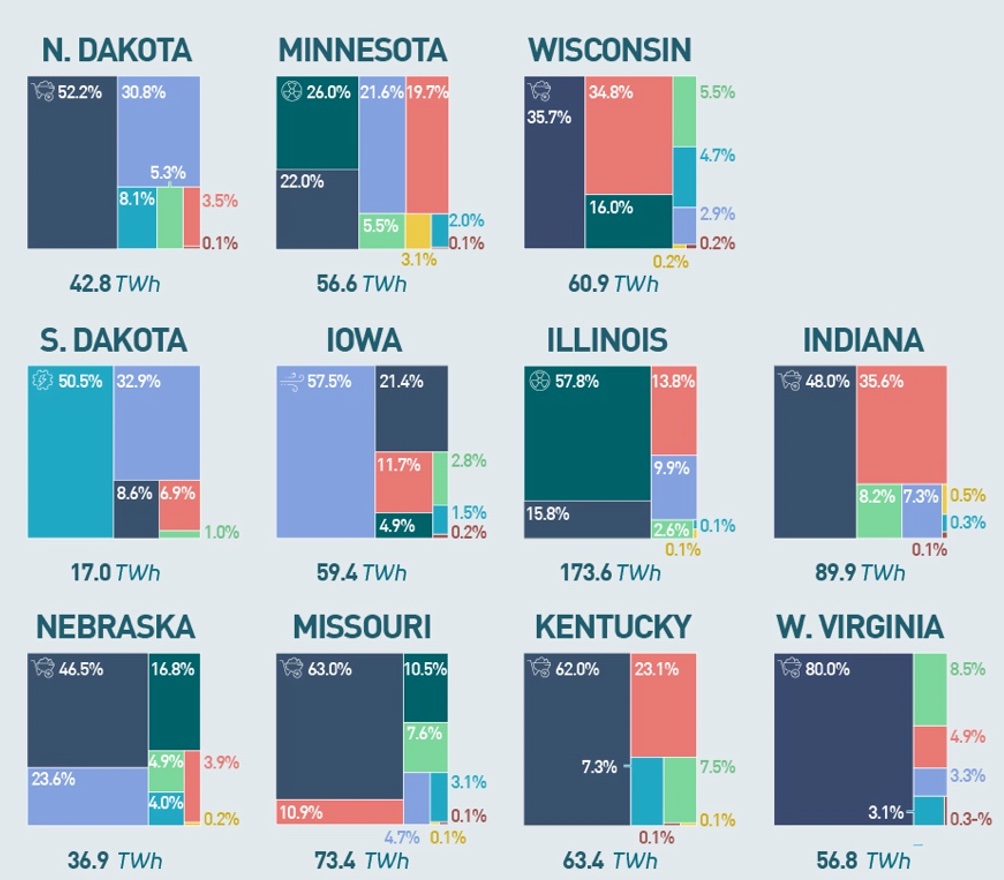
- How? Look at the energy mix per state. As this map shows, some are way ahead of the curve. Others, not so much.
- Joe Biden’s home state of Delaware is America’s worst polluter – if only in relative terms.
The latest IPCC climate report is a Code Red for Humanity. With our current CO2 reduction efforts, we will not keep global warming under the 1.5° C limit set by the 2015 Paris Agreement. And that was only to avoid the worst effects of climate change. If we want to steer clear of catastrophic change, we need to reduce greenhouse gas emissions. Drastically. Now.
U.S. electricity generation: 4,009 TWh in 2020
One key area in need of cleaning up: energy production. In 2020, the U.S. produced 4,009 terawatt-hours of power (also written as 4,009 billion kWh, since one billion kWh is one TWh).
■ About 60 percent of that total came from fossil fuels like natural gas (40.3 percent), coal (19.3 percent), and petroleum (0.4 percent), all of which have CO2 emissions as an undesirable side effect.
■ Nuclear energy accounted for just under 20 percent. It is debated whether nuclear power falls under the category of “sustainable,” but at least it doesn’t emit any greenhouse gases.
■ So-called renewables make up the remaining 20 percent, the main ones being wind (8.4 percent), hydro (7.3 percent) and solar (2.3 percent). Smaller renewable energy sources are biomass (1.4 percent) and geothermal (0.4 percent).
How do we get the CO2 out of electricity? One plan is the Clean Electricity Performance Program, which would require U.S. electricity producers to systematically decarbonize their operations year over year. The CEPP has just passed the committee stage in Congress but faces strong opposition and may not make it into law in its current form. Whatever legal instrument is eventually chosen, though, there is some good news for the road ahead.
For as this map shows, the national average masks huge differences per state. In fact, you could see the U.S. as a giant electricity-generating laboratory, with each of the 50 states (plus D.C.) pursuing their own strategic choices, producing radically different outcomes — some of which are already remarkably sustainable.
Best in class: Vermont
If we include nuclear in the sustainable column, the states with the most sustainably produced electricity are:
- Vermont (99.8 percent)
- South Dakota (84.4 percent)
- Washington (84.1 percent)
- Maine (82.1 percent)
- Idaho (79.2 percent)
- New Hampshire (77.5 percent)
- Illinois (70.5 percent)
- Oregon (68.6 percent)
- Iowa (66.7 percent)
- Kansas (66.1 percent)
Vermont’s nation-leading result is achieved mainly via hydro (57.8 percent), biomass (17.8 percent) and wind (16.2 percent). But of course, the Green Mountain state is the nation’s sustainability champion only in relative terms. Producing just 2.4 TWh of electricity in 2020, it is only a small player in a national energy market that generated 4,009 TWh.
In absolute terms, Washington cuts an impressive figure in the top ten. In 2020, the state generated 96 TWh (84.1 percent) of its 114.2 TWh electricity output from sustainable sources. Even more impressive is Illinois, even though it is a bit further down the list. The Land of Lincoln generated a lower share (70.5 percent) of a much larger output (173.6 TWh) from non-fossil fuel sources, which translates to 122 TWh of electricity generated sustainably.
It should be noted that these two states have two radically different energy mixes. Washington generates 66.1 percent of its power from hydro. Illinois gets 57.8 percent of its electricity from nuclear.
Worst in class: Delaware
So much for the top of the class. While they get at least two-thirds of their electricity from sustainable sources, none of the bottom ten even manages a quarter. They are:
- Delaware (5.4 percent)
- Rhode Island (8.1 percent)
- Mississippi (13.4 percent)
- Kentucky (14.9 percent)
- West Virginia (14.9 percent)
- Indiana (16.3 percent)
- Florida (17.3 percent)
- Utah (19.1 percent)
- Ohio (22.5 percent)
- Hawaii (22.5 percent)
President Biden’s home state of Delaware holds a deplorable record in electricity production. The First State is dead last when it comes to its share of sustainably generated power. Incidentally, Delaware is also the state that relies most heavily on natural gas for its energy (92.3 percent, just ahead of Rhode Island at 91.8 percent and well ahead of Mississippi in third placed at 80.4 percent).
The next three worst-performing states rely mostly on coal (which is more polluting than natural gas): Kentucky (62 percent), West Virginia (80 percent), and Indiana (48 percent). Hawaii is the only state on this list to rely primarily on petroleum (66.1 percent).
Electricity from gas? Nobody beats Texas
Well, at least Delaware is small, and so is the amount of natural gas-based pollution that it spews into the air to get its electricity. In absolute terms, nobody beats Texas.
In 2020, about 40 percent of America’s electricity (or 1,617 TWh) came from natural gas. Almost one-sixth of that national total was generated in the Lone Star State. The 10 states producing most electricity from natural gas were:
- Texas (248 TWh)
- Florida (188 TWh)
- Pennsylvania (120 TWh)
- California (92 TWh)
- Louisiana (72 TWh)
- Virginia (62 TWh)
- Georgia (59 TWh)
- Alabama (55 TWh)
- New York (53 TWh)
- Mississippi (53 TWh)
West Virginia, America’s coal champion
Turning to the second-biggest energy source on the non-sustainable list, West Virginia relies more on coal than any other state (80 percent), and five further states derive more than half their electricity from the black stuff: Wyoming (72.8 percent), Missouri (63 percent), Kentucky (62 percent), Utah (55.4 percent), and North Dakota (52.2 percent). But again, it is Texas that burns more coal than any other state to keep the lights on:
- Texas (71 TWh)
- Missouri (46 TWh)
- West Virginia (45 TWh)
- Indiana (43 TWh)
- Ohio (40 TWh)
- Kentucky (39 TWh)
- Wyoming ( 30 TWh)
- Illinois ( 27 TWh)
- Michigan (25 TWh)
- North Dakota (22 TWh)
Double, double oil and trouble
Petroleum is the smallest of the fossil-fuel sources for electricity. Hawaii is the nation’s leading petroleum-guzzler both in relative terms (by far, at 66.1 percent, with Alaska second at 16 percent) and in absolute terms, generating 6 TWh of electricity from petroleum. Following (in absolute terms) are Louisiana (3 TWh) and Florida (2 TWh).
So, which road to follow toward a carbon-free future for the energy sector? As the data shows, the path forks.
America’s most nuclear states
A number of states have clearly opted for nuclear power as a major element in their energy mix. Overall, nuclear power produces one-fifth of the nation’s energy — more than any other sustainable source. In three states, it even generates more than half the power. Here are the ten leading “atomic” states:
- New Hampshire (59 percent)
- Illinois (57.8 percent)
- South Carolina (55.8 percent)
- Tennessee (47.3 percent)
- New Jersey (43.5 percent)
- Maryland (41.8 percent)
- Connecticut (38.2 percent)
- North Carolina (34.1 percent)
- Pennsylvania (33.1 percent)
- Alabama (32.1 percent)
In all, 29 states have “gone nuclear” to some extent. But many do not like nuclear power, and those who do not tend to opt for “renewable” sources — that is, solutions that neither produce greenhouse gases nor rely on finite resources. These add up to another fifth of America’s energy production. The ambition is that these can be scaled up to reduce and eventually eliminate the need for non-sustainable and non-renewable energy generation.
Iowa, the wind-powered state
In 2020, wind power (338 TWh) was the most important of these renewable energy sources. For now, Iowa (57.5 percent) is the only state to get more than half of its electricity from wind, but Kansas (43.3 percent) might get there soon too. For 14 other states, wind generates a double-digit share of its electricity. Only 11 states (plus D.C.) generated no electricity from wind whatsoever.
Texas, worst in class for energy from natural gas and coal in absolute terms, is also best in class when it comes to TWh generated by wind:
- Texas (93 TWh)
- Iowa (34 TWh)
- Oklahoma (30 TWh)
- Kansas (24 TWh)
- Illinois (17 TWh)
- California (14 TWh)
- North Dakota (13 TWh)
- Colorado (13 TWh)
- Minnesota (12 TWh)
- Nebraska (8 TWh)
Five hydro states
Hydro power, the second-most important renewable nationwide (291 TWh), is the biggest source of electricity in Washington (66.1 percent) and generates more than half the power in Idaho (58.7 percent), Vermont (57.8 percent), Oregon (51.9 percent), and South Dakota (50.5 percent). For hydro, Washington also leads the list of energy generated in absolute terms (*):
- Washington (75 TWh)
- Oregon (34 TWh)
- New York (31 TWh)
- California (21 TWh)
- Alabama (12 TWh)
- Idaho (11 TWh)
- Montana (11 TWh)
- Tennessee (10 TWh)
- South Dakota (9 TWh)
- North Carolina (7 TWh)
Biomass: single digits mainly
Electricity from biomass is the third-largest source of sustainable energy in the U.S. (144 TWh in 2020) and is part of the energy mix of every single state, plus D.C. If biomass flies under the radar somewhat, it is because it is a single-digit contributor in all but three places: D.C. (26.4 percent), Maine (23.4 percent), and Vermont (17.8 percent).
In absolute terms, it is again Texas that leads the ranking:
- Texas (12 TWh)
- California (8 TWh)
- Indiana (7 TWh)
- Florida (7 TWh)
- Ohio (6 TWh)
- Pennsylvania (6 TWh)
- Michigan (6 TWh)
- Missouri (6 TWh)
- Georgia (5 TWh)
- North Carolina (5 TWh)
Going solar? Not so fast
From all the space and attention taken up by solar panels, you would think this was the main source of renewable energy. It is in fact only the fourth most important one, generating just 91 TWh nationwide in 2020. No state has solar as its main source of electricity. It achieves its three highest shares in the energy mix of two sun-kissed states, California (15.7 percent) and Nevada (13 percent), and — surprisingly — D.C. (8.8 percent).
For once, it is California and not Texas leading the list of states who get the most TWh from this energy source:
- California (30 TWh)
- North Carolina (9 TWh)
- Texas (8 TWh)
- Florida (6 TWh)
- Arizona (6 TWh)
- Nevada (5 TWh)
- Georgia (4 TWh)
- Utah (2 TWh)
- South Carolina (2 TWh)
- Minnesota (2 TWh)
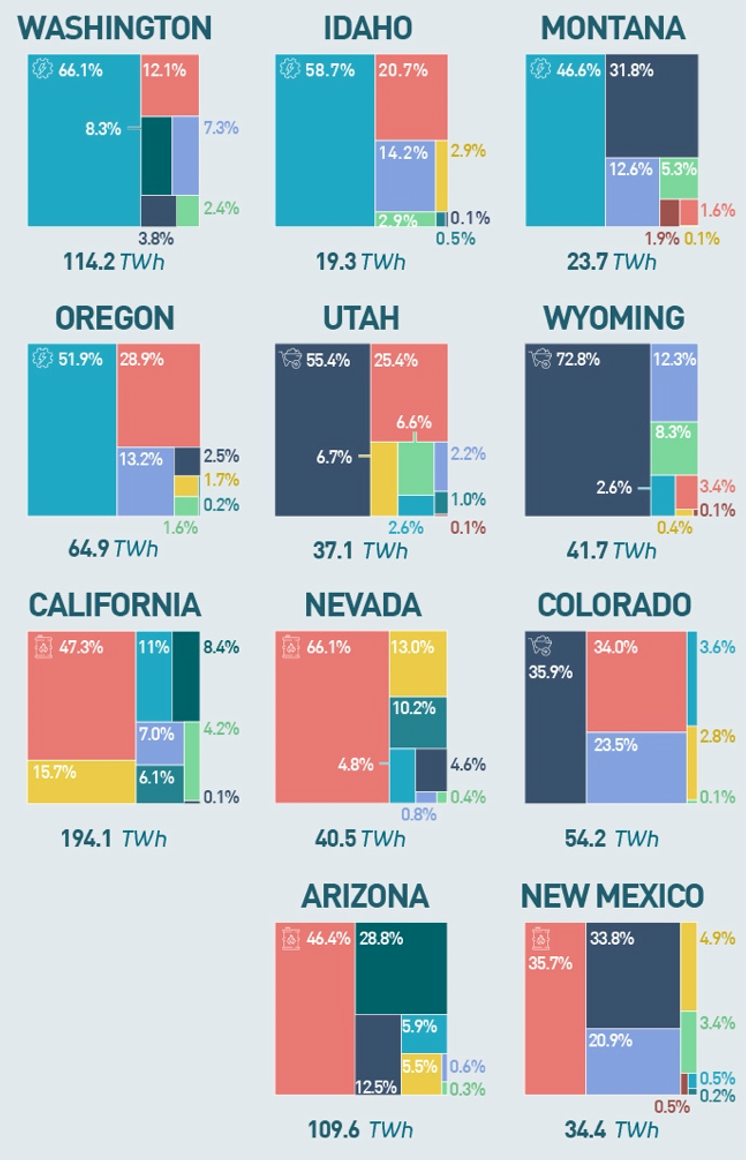
We can be brief about geothermal energy. It is the smallest of all energy sources nationwide (less than 17 TWh). It is significant only in Nevada (10.2 percent), California (6.1 percent), Hawaii (2.2 percent), and Utah (1 percent); generates less than one percent in Idaho, New Mexico, and Oregon; and contributes nothing everywhere else.
This map was produced by Visual Capitalist (and can be found here in its original context). It is reproduced here with kind permission. The graph was produced by the National Public Utilities Council, and the data comes from the U.S. Energy Information Administration.
Strange Maps #1108
Got a strange map? Let me know at strangemaps@gmail.com.
Follow Strange Maps on Twitter and Facebook.
*: And not Texas, as previously stated (list corrected on 30 Sept 2021, 7:35 am ET).


