These Chinese Cities have GDPs that Match Those of Entire Countries

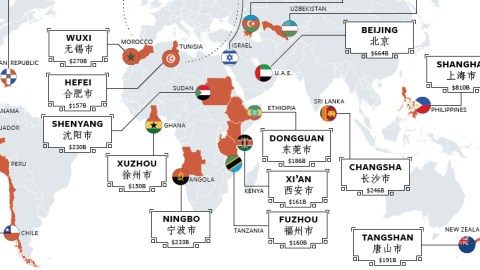
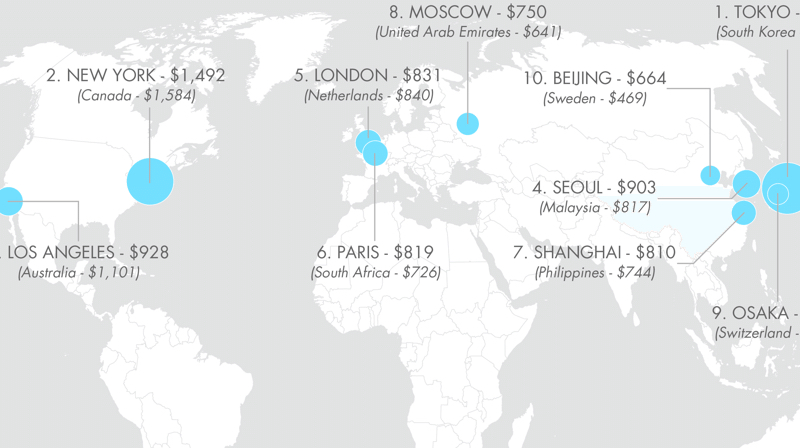
Remember that map that compares the GDP of individual U.S. states with entire countries? (If you don’t: #864). It provides a stark reminder of the size of the American economy, by many measurements still the biggest in the world. But an equally impressive map can be drawn of China – the world’s second-largest and rapidly growing economy.
Beijing, Shanghai and Hong Kong are the only three names likely to figure on the very short list of Chinese cities that most non-Chinese can name. But, as this map demonstrates, there are quite a few cities more in China with GDPs that measure up to the economies of sizeable independent nations.

Switzerland has about the economic size of Guangzhou. Chile that of Chongqing. And Angola that of Ningbo. Even if those names have a less than familiar ring today, their economic might predicts that we’ll hear more of them in the future.
The basis for this map was Chinese regional GDP (PPP) for 2015, in billions of U.S. dollars. In all, 35 cities are mentioned (scroll down for full list). While most people have heard of Shanghai, Beijing, Shenzhen and Hong Kong (and some might even be able to pinpoint them on the map), few people will be able to identify cities like Wuxi, Qingdao or Tangshan, despite the fact that they have economies similar to those of Morocco, Hungary and New Zealand, respectively.

#1 Shanghai$810 Philippines
#2 Beijing $664 U.A.E.
#3 Guangzhou $524 Switzerland
#4 Shenzhen $491 Sweden
#5 Tianjin $478 Romania
#6 Suzhou $440 Austria
#7 Chongqing $425 Chile
#8 Hong Kong $414 Peru
#9 Wuhan $324 Israel
#10 Chengdu $306 Norway
#11 Hangzhou $275 Greece
#12 Nanjing $272 Denmark
#13 Wuxi $270 Morocco
#14 Qingdao $266 Hungary
#15 Changsha $246 Sri Lanka
#16 Dalian $245 Finland
#17 Foshan $235 Uzbekistan
#18 Ningbo $233 Angola
#19 Shenyang $230 Sudan
#20 Zhengzhou $210 Ecuador
#21 Tangshan $191 New Zealand
#22 Dongguan $186 Ethiopia
#23 Yantai $184 Belarus
#24 Jinan $174 Azerbaijan
#25 Nantong $170 Slovakia
#26 Changchun $163 Dominican Republic
#27 Xi’an $161 Kenya
#28 Fuzhou $160 Tanzania
#29 Harbin $159 Bulgaria
#30 Hefei $157 Tunisia
#31 Shijiazhuang $156 Guatemala
#32 Xuzhou $150 Ghana
#33 Changzhou $147 Serbia
#34 Wenzhou $131 Croatia
#35 Zibo $123 Panama
If reading that list leaves you somewhat bewildered, it helps to know that many of those high-performing Chinese cities do not exist in isolation; in fact, a lot of names on the above list can be found of this map, of three megaregions clustering on the coast:

Well, at least that’ll help us sort out Changzhou (Yangtze River Delta) from Guangzhou (Pearl River Delta) in future.
Map found here on V, a media website that creates and curates visual content on investing and business.
Strange Maps #867
Got a strange map? Let me know atstrangemaps@gmail.com.


