Ask Ethan: Why Are Maps Of The Cosmos Oval-Shaped?

They don’t look like our other spherical maps we’re used to seeing. So what’s actually going on?
“The bedrock nature of space and time and the unification of cosmos and quantum are surely among science’s great ‘open frontiers.’ These are parts of the intellectual map where we’re still groping for the truth — where, in the fashion of ancient cartographers, we must still inscribe ‘here be dragons.’” -Martin Rees
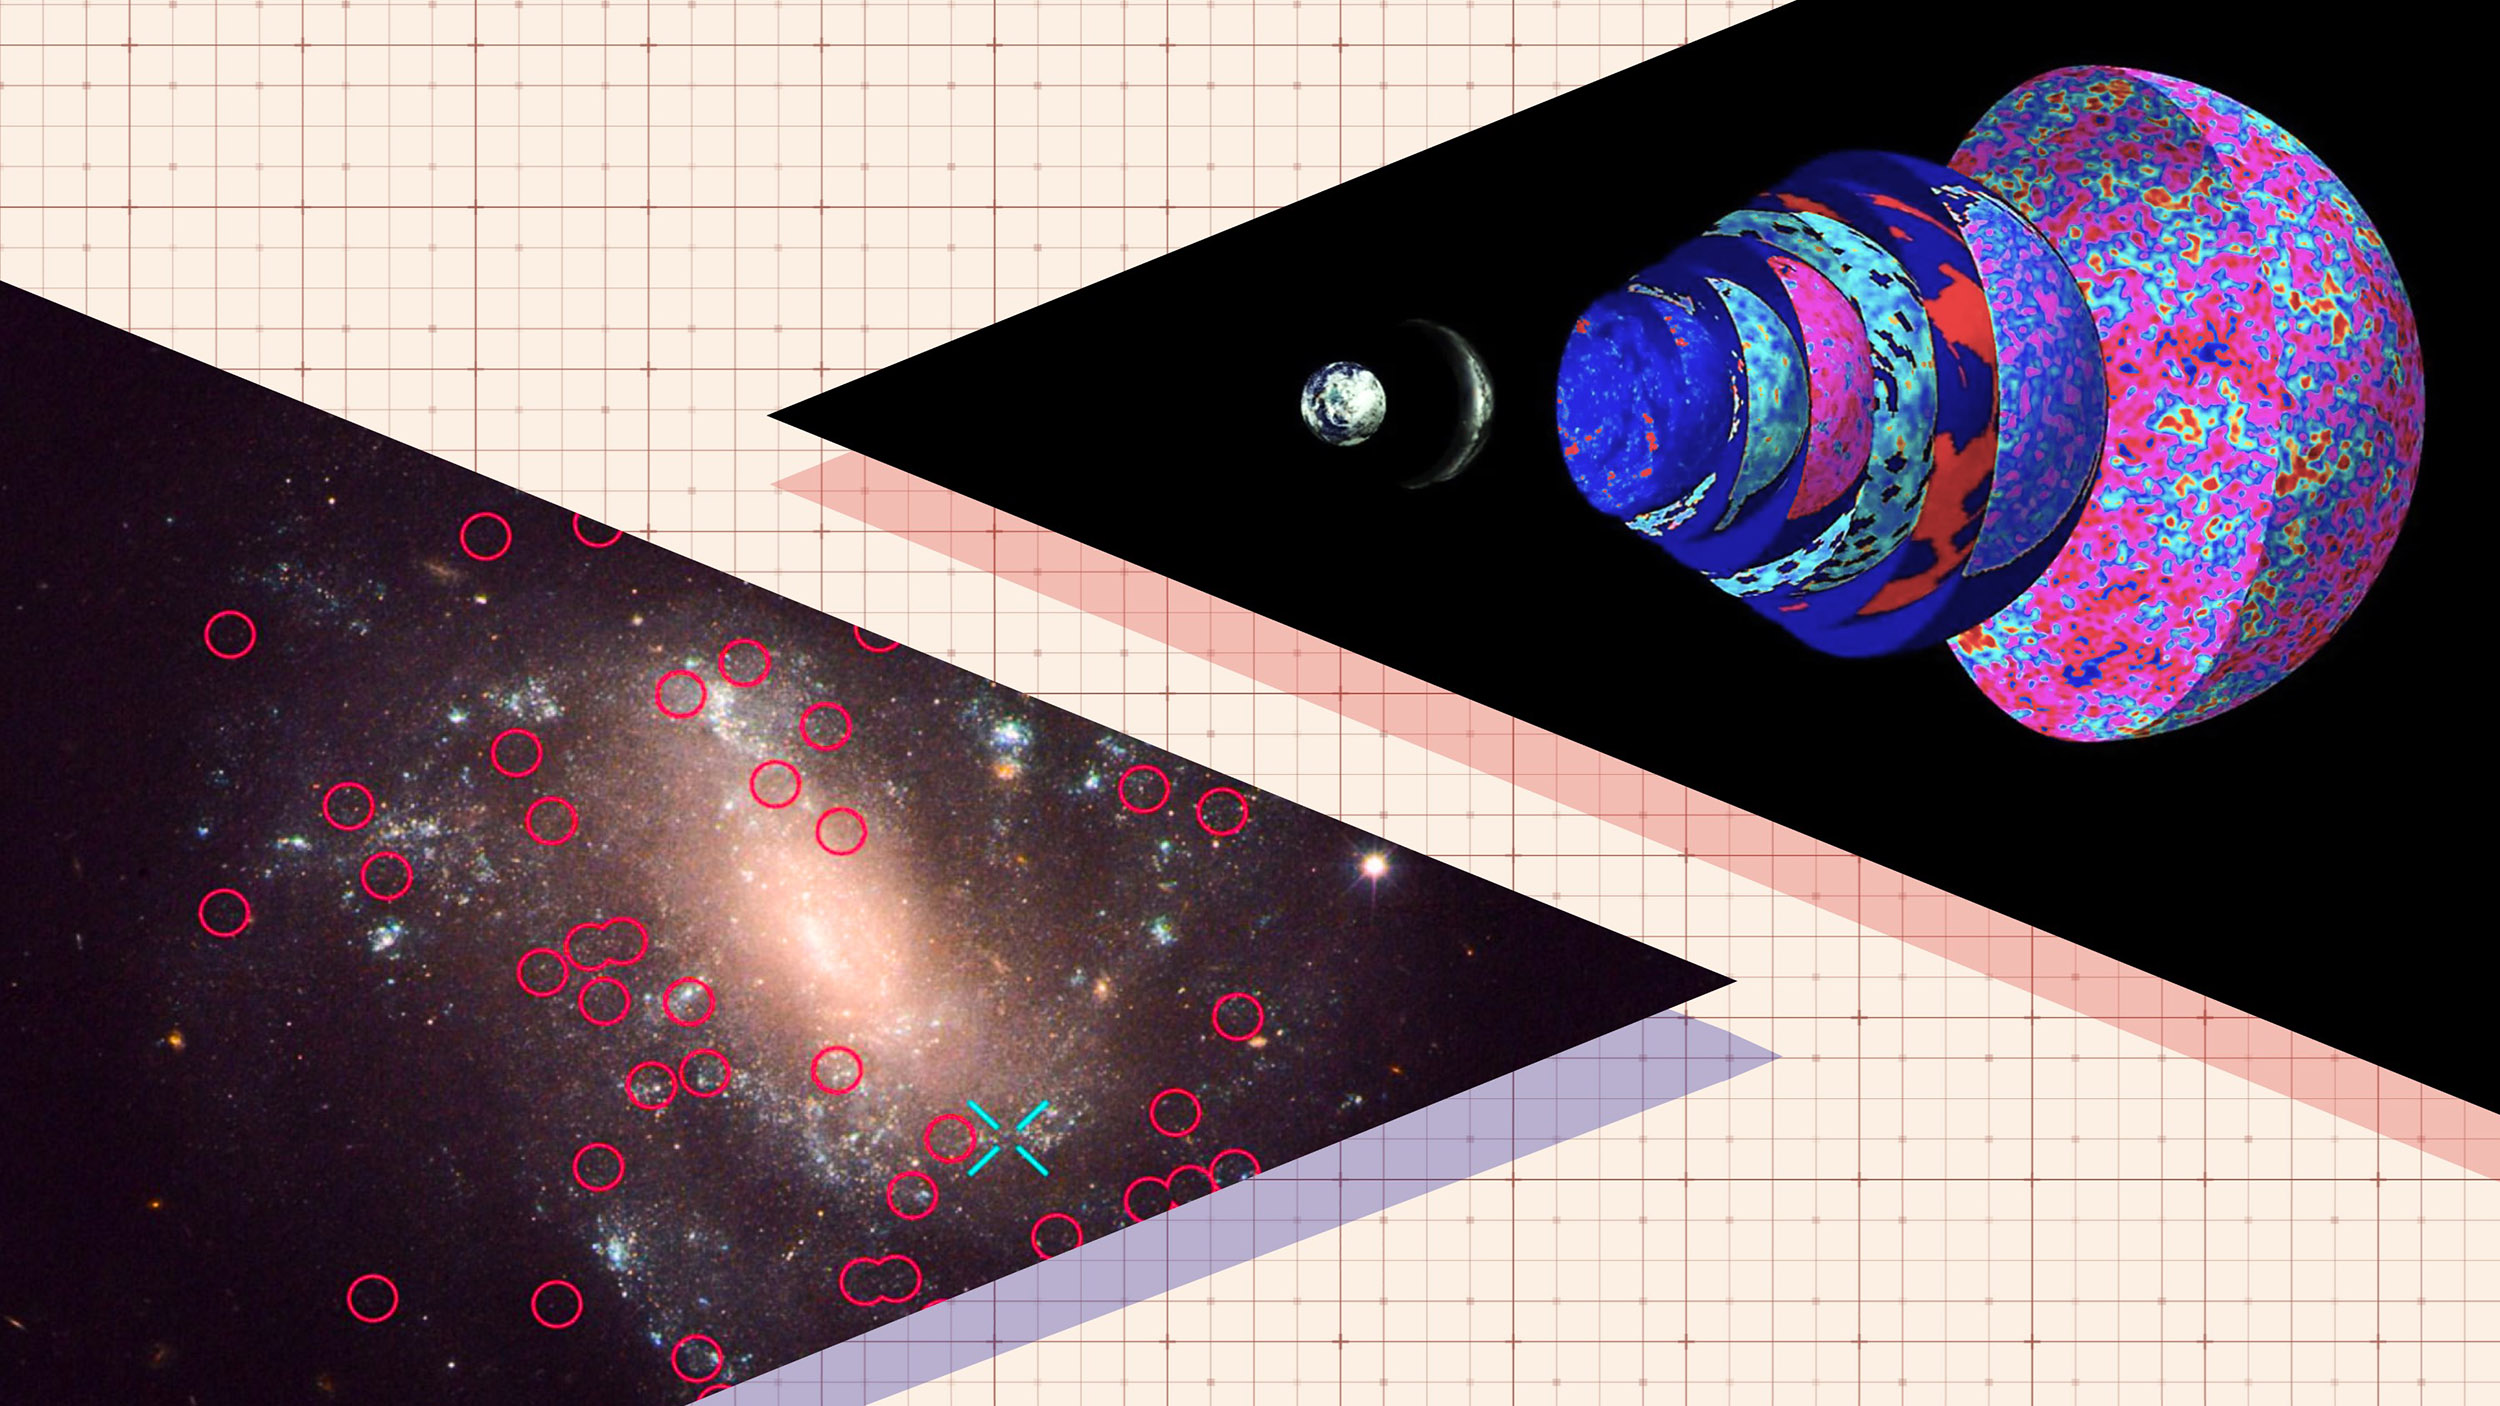
When you look out at the Universe from our vantage point, it’s pretty clear that you can look in any direction you like. You have the full range of three-dimensional space to look out in, and wherever you look, it’s more Universe all the way around. So why is it, then, that when you see a map of the Universe, it looks like an elliptical shape? As part of our Ask Ethan series, teclontz submitted a question and wants to know:
Why are the microwave background radiation graphs oval and not symmetrically round?
They should be symmetric, after all, shouldn’t they? So why do they look like the picture atop, rather than what you might expect, below?
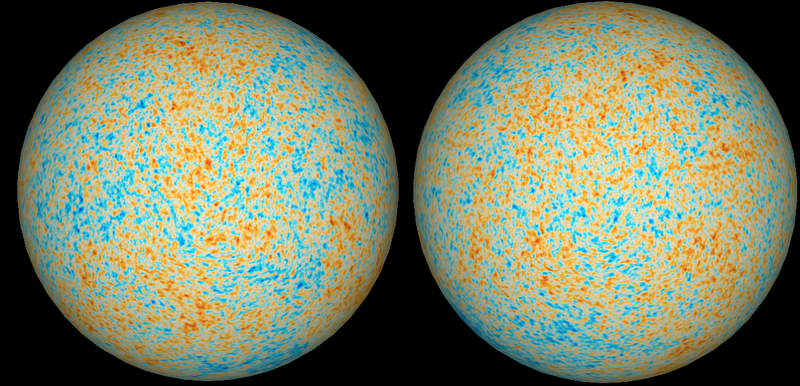
Believe it or not, these two maps contain exactly the same amount of information! This is exactly like the Earth, which is a sphere, but which can be represented in a number of different ways. If we wanted to be as accurate as possible, we’d portray Earth as a globe: a spheroidal entity that’s as true-to-reality as possible. We’ve actually seen it in its entirety as it rotates, having imaged it directly from space.
But this is often unwieldy, and is completely useless when we’re dealing with a two-dimensional surface. Therefore, we normally choose to portray our three-dimensional Earth — with it’s two-dimensional surface — as a map. Although it isn’t normally talked about, there are a few things that get lost in translation when we go from a globe to the flat surface of a map. We typically represent the map to show lines of latitude and longitude being perpendicular to one another, which is a style (and a choice) known as a Mercator projection.
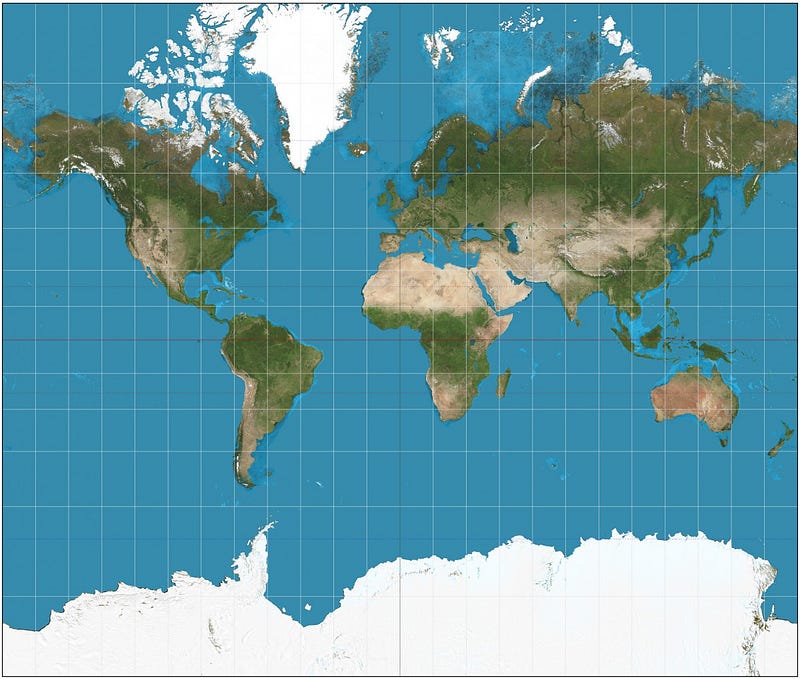
The thing you must realize — that most people don’t realize — is that this map isn’t accurate. In the interest of keeping lines of latitude and longitude perpendicular (which they are) on this map, we’ve distorted the areas at non-equatorial latitudes. Looking at the map, it appears that Greenland and South America are about the same size, than Antarctica is about as big as Europe and Asia combined, and that Iceland is almost the same size at the United Kingdom.
But none of these things are true, and you can see that if we make a different choice of how we map it!
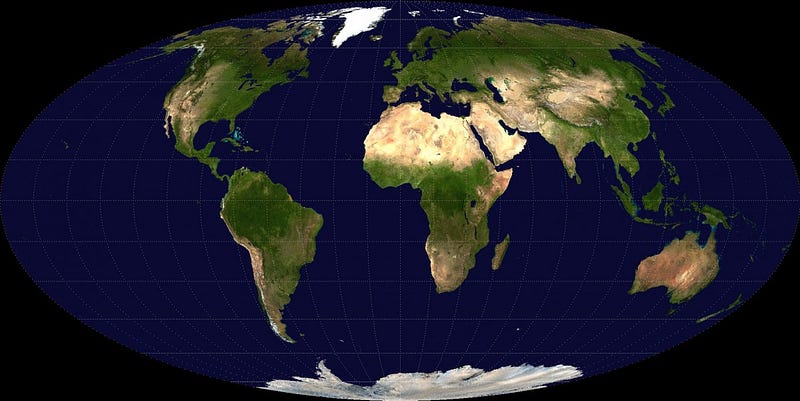
Above is a Mollweide projection, which shows areas and shapes accurately, but gives up lines of latitude and longitude being perpendicular as the tradeoff. Greenland is only about one eighth the size of South America, Antarctica is a quarter the size of Eurasia, and Iceland is less than half the area of the United Kingdom. In fact, there are four things that you have to trade off between whenever you map any curved surface to a flat one:
- perpendicularity of latitudes and longitudes,
- preservation of areas to be accurate,
- connectedness, and
- distortion of shapes.
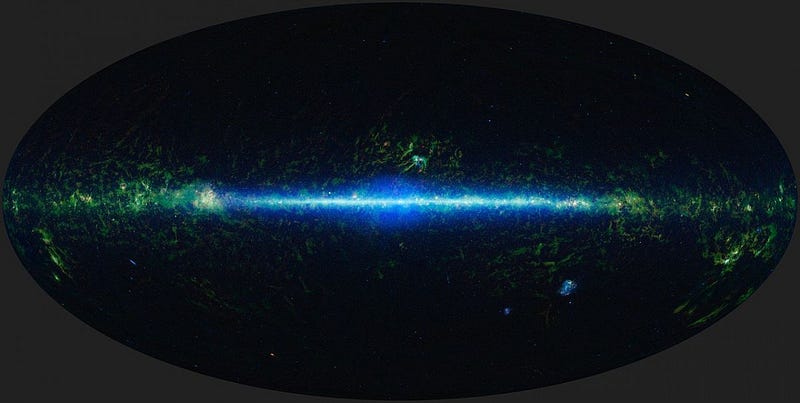
You can pick two or three, but no more. The Mollweide projection is what we use (typically) for maps of the entire night sky, including in the infrared,
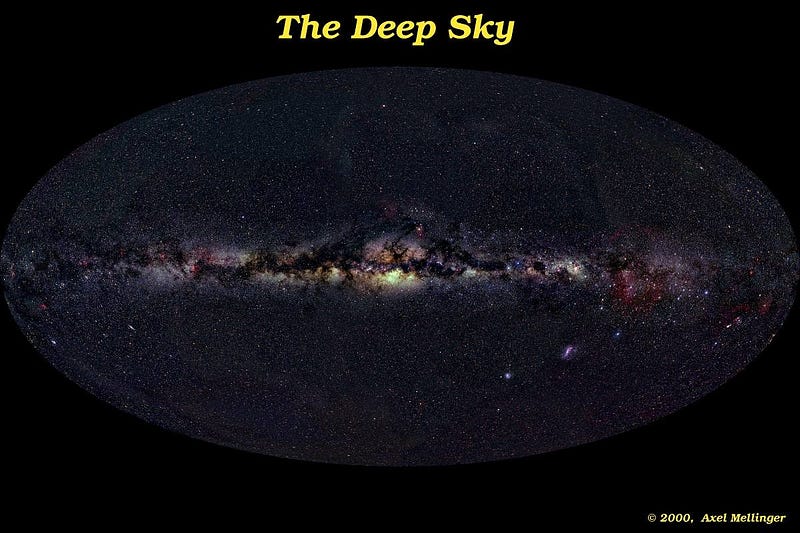
mapping the Milky Way in visible light,
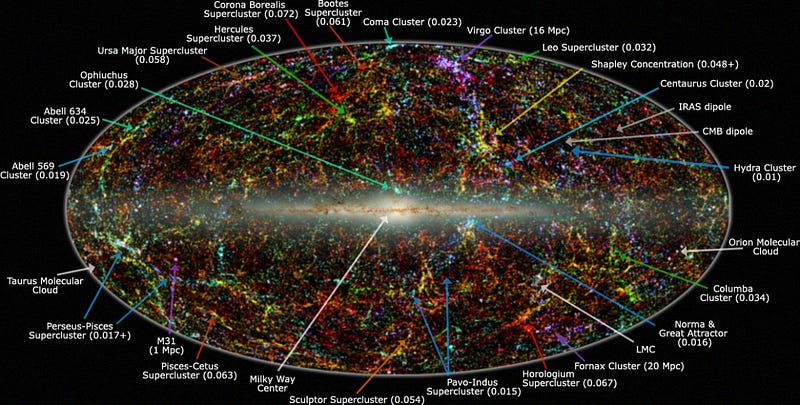
or even — after subtracting out the stars of our galaxy — mapping the large-scale structure of the Universe.
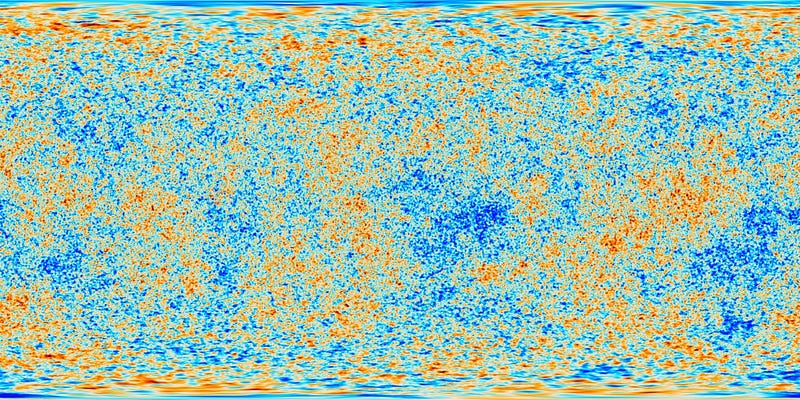
We don’t have to make this choice; we could use the Mercator projection, the same way we do for Earth. I’ll prove it to you: here’s the cosmic microwave background displayed the same way you normally see a map of the Earth.
There are lots of other choices that we could have made, including the Eckert IV projection, the HEALPix projection, or — for those of you who like peeling an orange in one continuous strip and then flattening it, and hence don’t value connectedness — the disgustingly awful Goode homolosine projection. (But why don’t I tell you how I really feel?) All of these maps contain the same amount of information as one another, and all are capable of showing the entire sky, albeit with different trade-offs.
When we look at the Universe, it’s important to see areas represented accurately and to see as little distortion as possible, and that’s why we make the choices we do. For other purposes, having latitude and longitude lines be perpendicular matter more, and so a different choice is more useful. I’ll just tell you that if we went with the “symmetrically round” version you suggested, we’d need two disconnected images — like two hemispheres — to see the entire sky, and so that’s why we don’t choose it. Personally, I like it, and found I could get used to it pretty quickly, but now you know what you’re looking at when you see the Universe from this point of view!
Submit your questions and suggestions for the next Ask Ethan here!
This post first appeared at Forbes. Leave your comments on our forum, check out our first book: Beyond The Galaxy, and support our Patreon campaign!