How does the CMB tell us what’s in the Universe?

The Big Bang’s leftover glow tells us a lot more than just where we came from.
“Cosmology is the study of the origin, evolution, and fate of objects in the observable universe. […] The key to the birth and evolution of such objects lies in the primordial ripples observed through light shining through from the early universe.” –Wayne Hu
The hot Big Bang might have started our Universe as we know it some 13.8 billion years ago, but there’s a piece of it still visible to us today. Because the “bang” happened everywhere at once, there’s light that’s been traveling in all directions for 13.8 billion years, and some of it is just arriving at our eyes today. Because the Universe has been expanding this entire time, the wavelength of that initially hot light has gotten stretched, all the way from gamma rays through visible light and into the microwave portion of the spectrum. This leftover glow from the Big Bang shows up today as the Cosmic Microwave Background, or CMB. Today, it’s perhaps the best piece of evidence we have for what the Universe is made of.
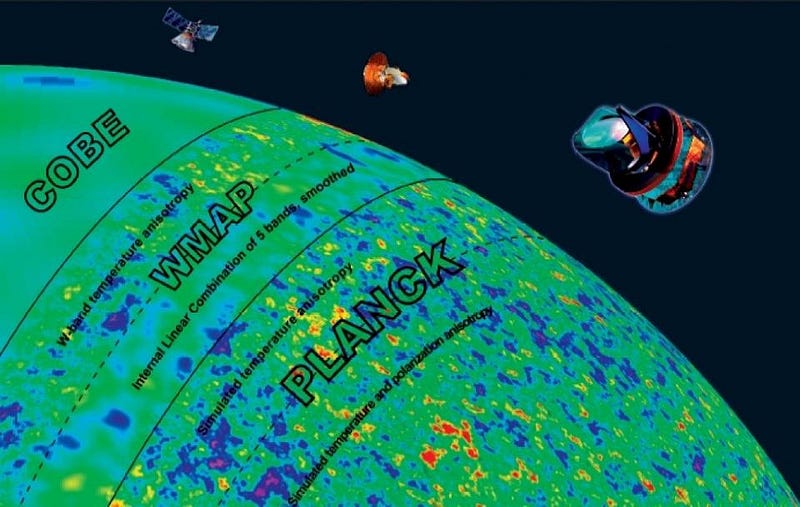
When it was first detected back in 1965, it was an incredible confirmation of the idea that the Universe came from a hot, dense, uniform state, with its temperature and spectrum matching the theory’s predictions exactly. But as our ability to measure the CMB’s imperfections grew and grew, we learned more than anyone in 1965 could have imagined. On average, the Big Bang’s leftover glow gives us a Universe whose temperature is 2.725 K, just a few degrees above absolute zero. But there are imperfections in that temperature as well if we look in different directions. They’re very small compared to the average temperature, with the “largest” imperfection coming in at just 3 millikelvins (mK).
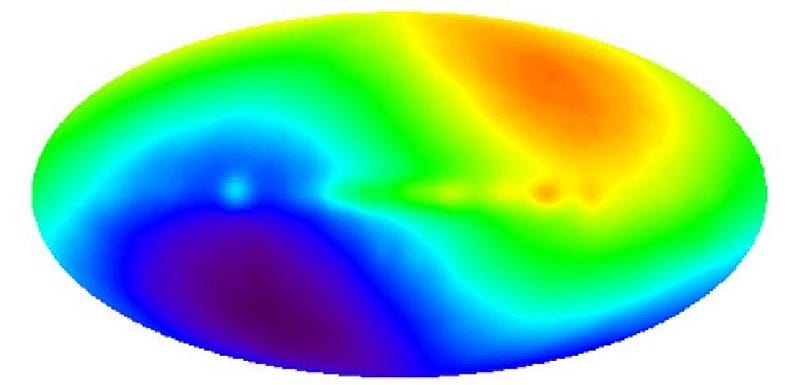
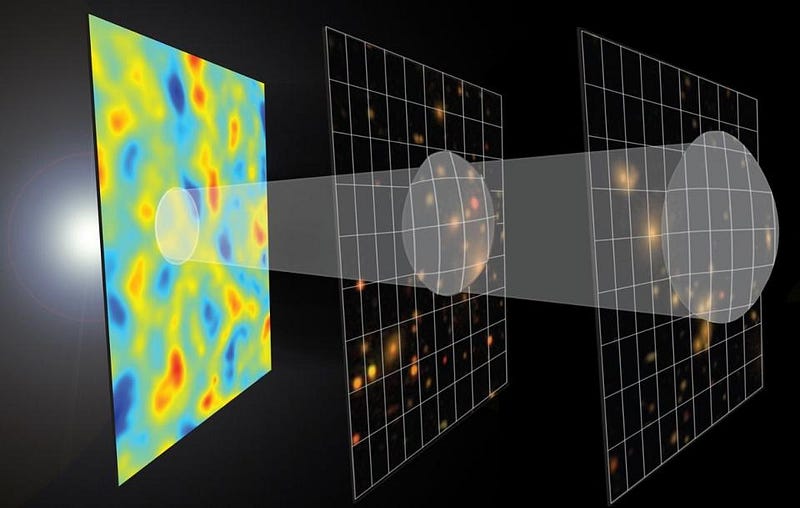
This characteristic pattern — that it’s “hotter” in one direction and “cooler” in the opposite one — tells us how fast we’re moving through the Universe, relative to the rest frame of the expanding Universe. But if we subtract that out, we find that we have to go down to much smaller-magnitude fluctuations to find the temperature differences: microkelvin (µK) scales. If we go down that far, we get a snapshot of the tiny gravitational imperfections in the very young Universe. Thanks to the Planck satellite, we can see these imperfections down to angular scales of less than 0.1º.
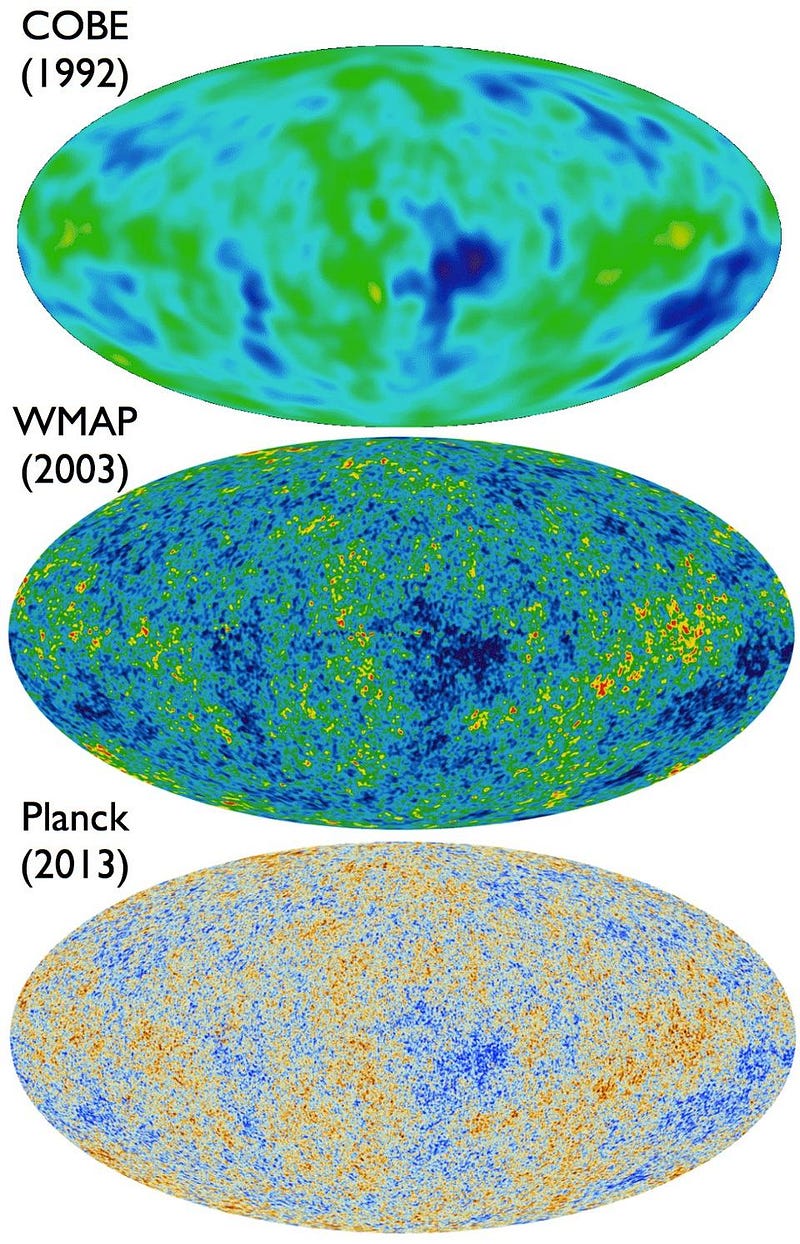
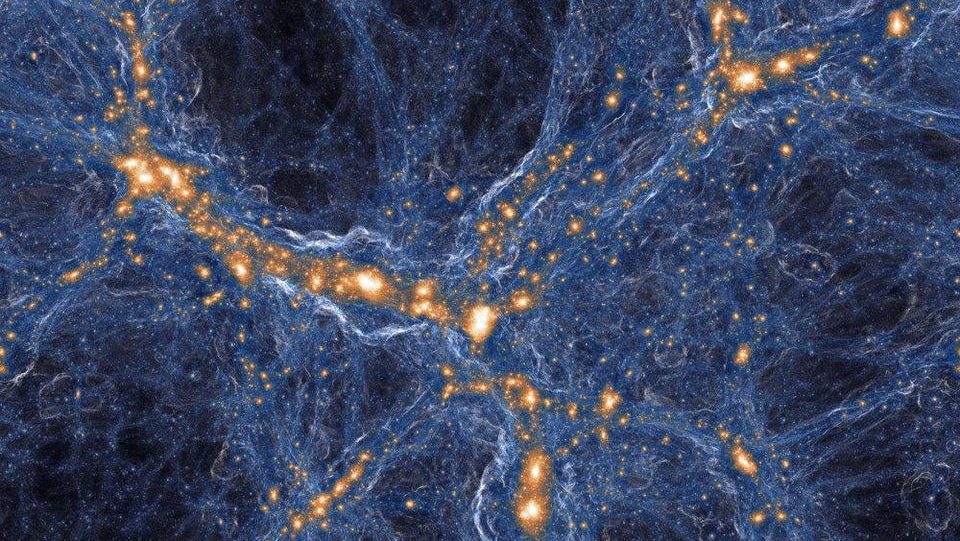
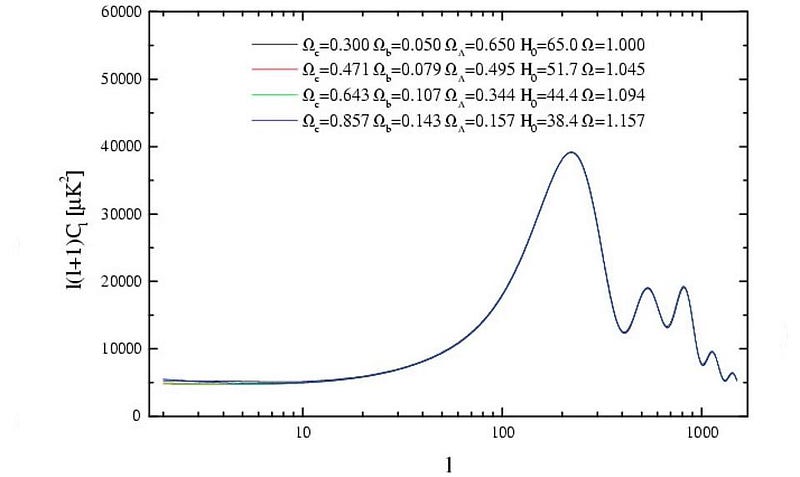
While these images might look like nothing more than noise to your eyes, there’s actually a tremendous amount of data packed in there. Imagine that you could divide the sky up a certain number of independent ways: 5, 15, 25, 150, etc., and measure how large the mean temperature fluctuation is on each and every scale. Every force and component of energy present in the Universe, including protons, neutrons and electrons, dark matter, radiation, dark energy, gravitational imperfections and more will influence how the fluctuations behave on each and every scale.
Some spots are hotter than others; some are colder than others; some are exactly average. But by asking what the mean fluctuation is on each scale — by averaging the departure of the independent components from the mean together — we can quantify how the temperature varies at each angular scale. There’s a tremendous amount of information encoded in the results, and they enable us to determine exactly what makes up the Universe with just a little bit of extra information thrown in.
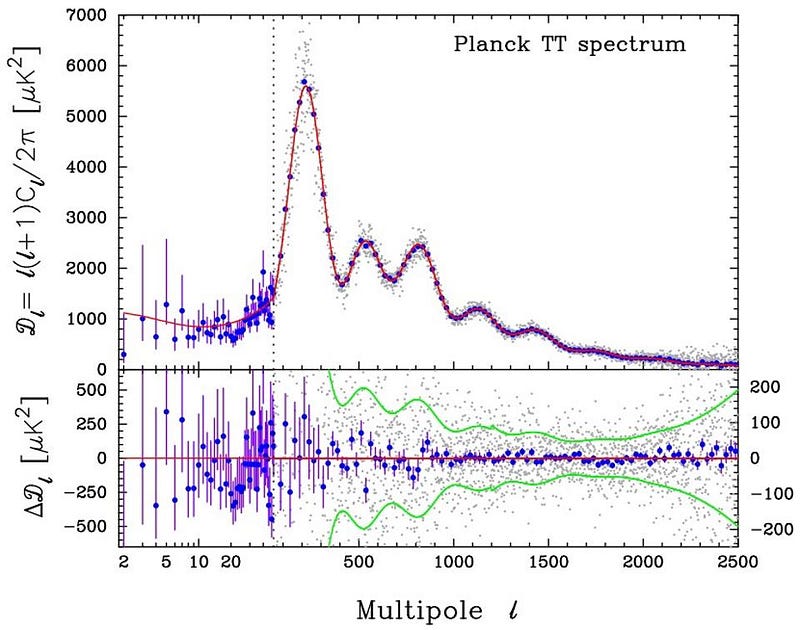
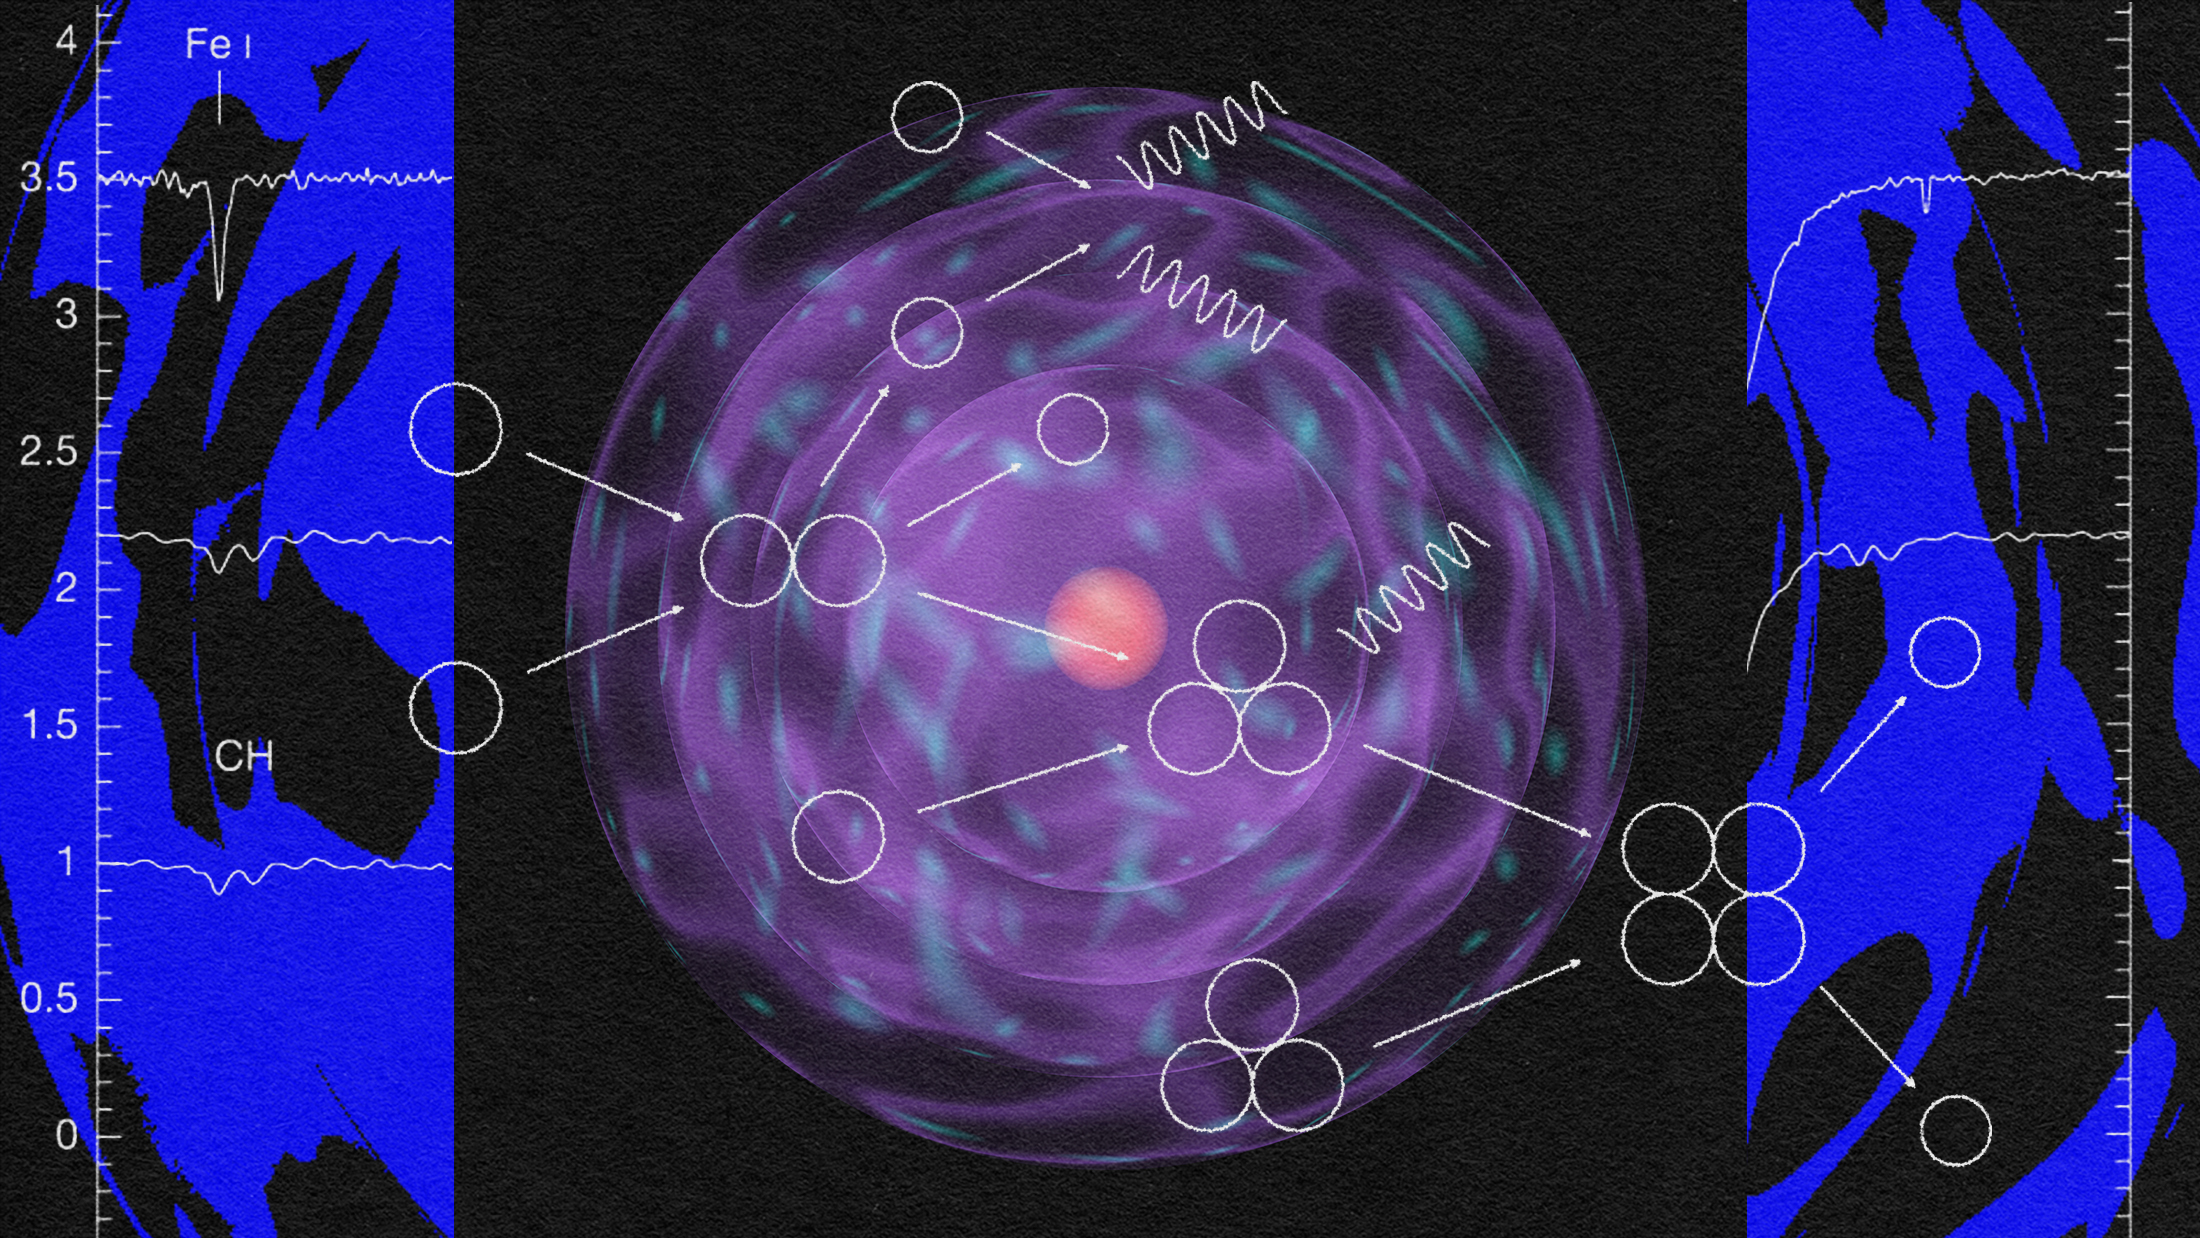
The “line” of best-fit might look pretty arbitrary, but it’s actually extremely sensitive to a whole slew of different components in the Universe. On the left (the largest scales), the height and slope of the “flat” part tells us how deep the large-scale fluctuations are in the Universe and how they grow over time: the Sachs-Wolfe and Integrated Sachs-Wolfe effects. As you go to smaller scales, the height of that big, first peak tells us what the density of baryons (protons, neutrons and electrons combined) is: about 5% of the critical density. The angular scale — or horizontal location — of that peak tells us what the total curvature of the Universe is: about 0% (with an uncertainty of about 2%). The relative height of the second and third peaks tell us what the ratio of normal matter to dark matter is: about 1-to-5. Without dark matter, we’d have no second peak at all.
It’s worth noting that for any given line you draw, you can arrive at multiple different parameters. This is known as a degeneracy problem; you can’t determine everything by measuring the CMB on its own. But if you measure just one other thing — like the Hubble expansion rate, for example — you break that degeneracy completely.
When we do, with the best CMB data available (from Planck), we arrive at a Universe that’s made of:
- about 4.9% normal, atomic-based matter,
- about 0.01% photons,
- around 0.1% neutrinos,
- about 26.3% dark matter,
- no cosmic strings,
- no domain walls,
- and 68.7% cosmological constant, with no evidence for dark energy being anything more exotic than this.
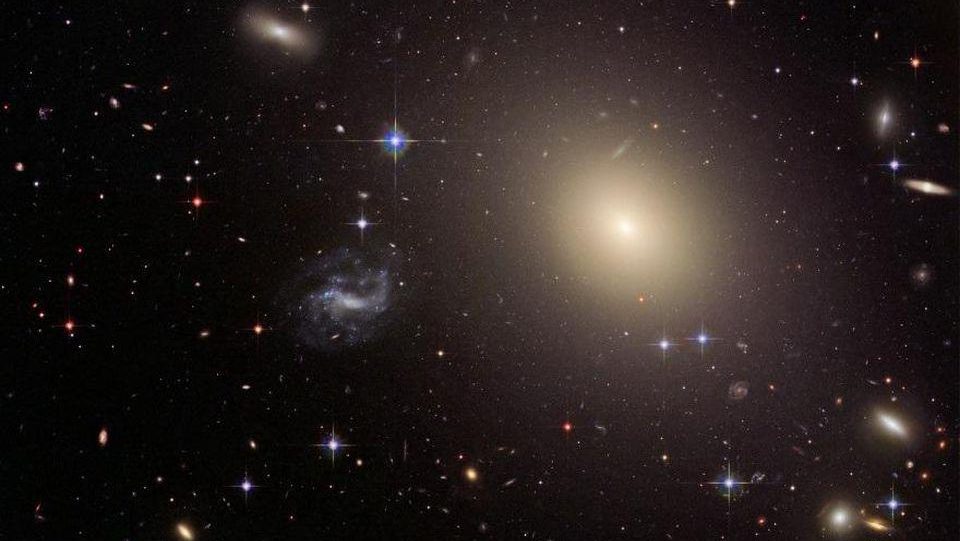
This is consistent with everything else we’ve observed, from how structure forms on the largest scales to gravitational lensing to supernova data to dark matter in clusters and galaxies. Any alternative cosmology to the Big Bang governed by General Relativity with dark matter and dark energy has to rise to this challenge as well. So far, no alternative has ever succeeded on this front. With unprecedented precision, the CMB tells us exactly what’s in the Universe. Perhaps the most remarkable fact of all is how many independent lines of evidence support the same exact picture.
This post first appeared at Forbes, and is brought to you ad-free by our Patreon supporters. Comment on our forum, & buy our first book: Beyond The Galaxy!