The Expanding Universe Might Not Depend On How You Measure It, But When

It’s been called the biggest conundrum in all of cosmology, and recent measurements just add to the confusion.
One of the most puzzling facts about the Universe is that different ways of measuring how fast it’s expanding yield different results. It’s not that there are two ways to measure it and they don’t agree; it’s that there are perhaps a dozen different ways of measuring it, and they yield two different sets of results. Both of them require a Universe filled with normal matter, dark matter, and dark energy, but their preferred values differ by about 9%: much greater than the uncertainties involved.
No sources of error have been identified that could explain the discrepancy, with multiple independent lines of evidence existing for both sets of results. Recently, however, a very clever new test of the Universe’s expansion rate has been devised and leveraged, and it appears to offer a clue like none before: the same test favors different values at late versus early times. Perhaps expanding Universe depends on when, rather than how, you measure it.
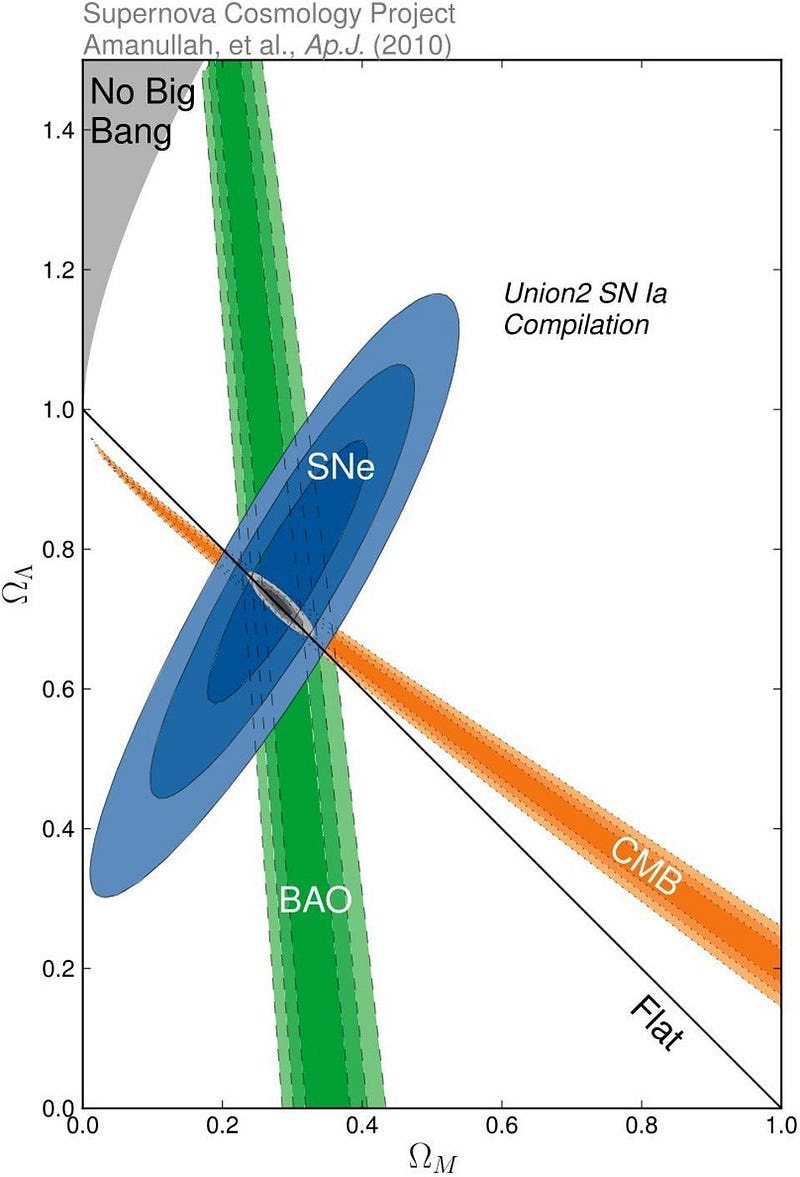
About a decade ago, there were three independent sets of measurements that all revealed properties of the Universe in comprehensive, complementary but independent ways:
- the fluctuations in the cosmic microwave background,
- the clustering of galaxies, galaxy clusters, and other features of the Universe’s large-scale structure,
- and direct measurements of distances-and-redshifts of individual objects, from individual nearby stars to distant supernovae across the Universe.
They all had uncertainties on their measurements, but they were all consistent with one another, yielding a Universe of about 5% normal matter, 25% dark matter, 70% dark energy, and an expansion rate that, today, was around 71 km/s/Mpc.
Variations on these values were permitted, and there was a little bit of wiggle-room with the various parameters, consistent between all observations. But as the science of these various techniques became better-understood and the data improved with increasingly precise observations and larger data sets, some puzzles began to emerge.
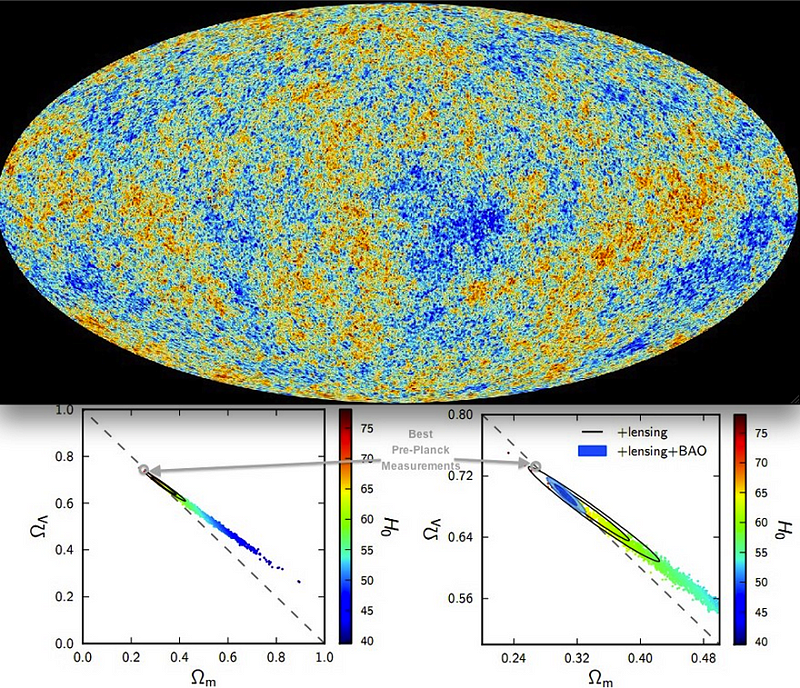
For one, the cosmic microwave background results became much more precise as the final results from the Planck satellite emerged. The patterns of fluctuations, corresponding to:
- the initial, seed fluctuations put down by cosmic inflation,
- their evolution through the combined forces of gravitation and the interaction of normal matter with radiation,
- and the propagation speed of signals in the dense, early Universe,
yielded a coherent picture all on its own that preferred a lower value of today’s expansion rate: 67 km/s/Mpc.
Gravitational collapse can only occur on scales where signals from different parts of the Universe have had time, since the Big Bang, to feel the effects of one another. Just as light can only travel through the Universe at a finite speed (the speed of light), gravity, too, is limited by its own cosmic speed limit: the speed of gravity, which has been shown to equal the speed of light.
The scale at which these fluctuations appear largest in magnitude corresponds to the largest scale on which this collapse of matter has occurred, at the time of the cosmic microwave background’s emission, before being “bounced” back away by the radiation in the Universe. At an angular scale of just slightly less than 1°, that corresponds to a specific physical scale at which we’re more likely to find a galaxy at a particular distance from another galaxy, as opposed to slightly closer or farther away. We call this the acoustic scale, and today it corresponds to a distance of approximately 500 million light-years.
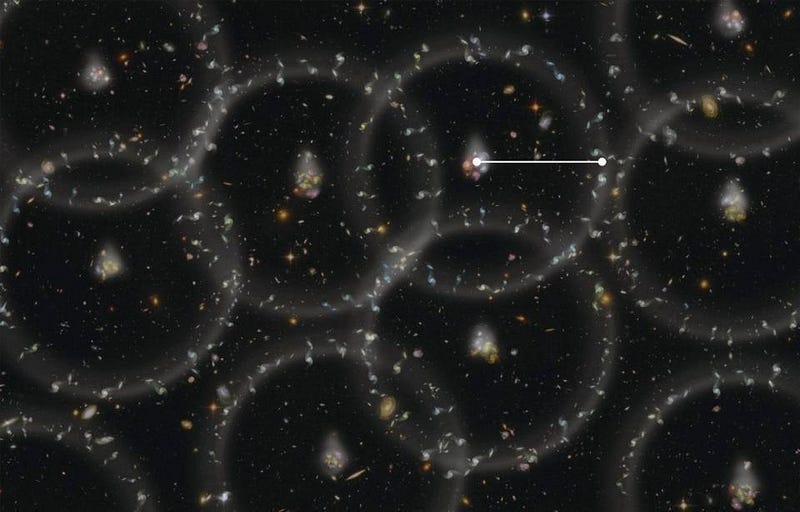
This second piece of the puzzle, then, is the link between the early-time signal of the acoustic scale imprinted in the cosmic microwave background and the later-time signal of galaxy clustering. These large-scale structure features, when you take all of the data together, have also shown an agreement with the cosmic microwave background’s measurements, favoring an expansion rate of 67–68 km/s/Mpc.
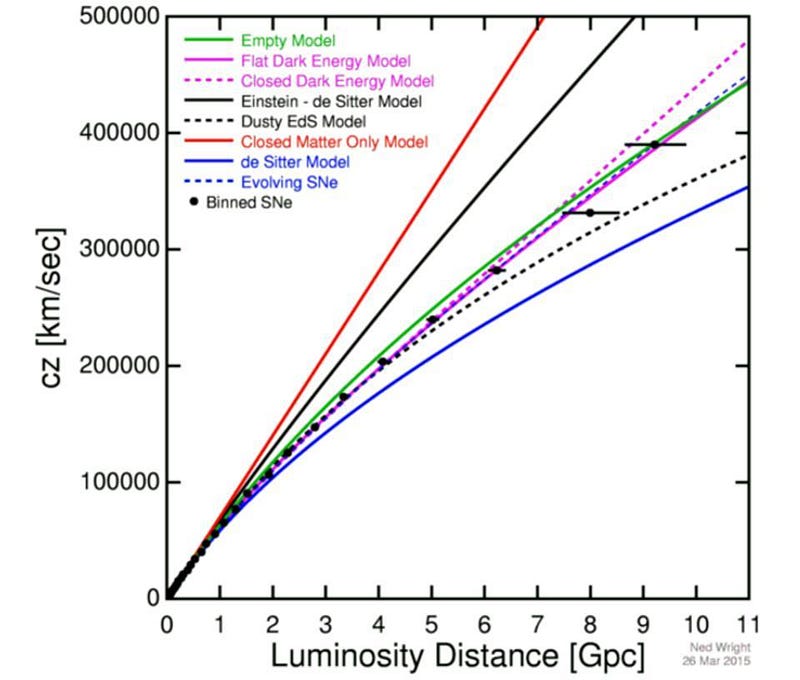
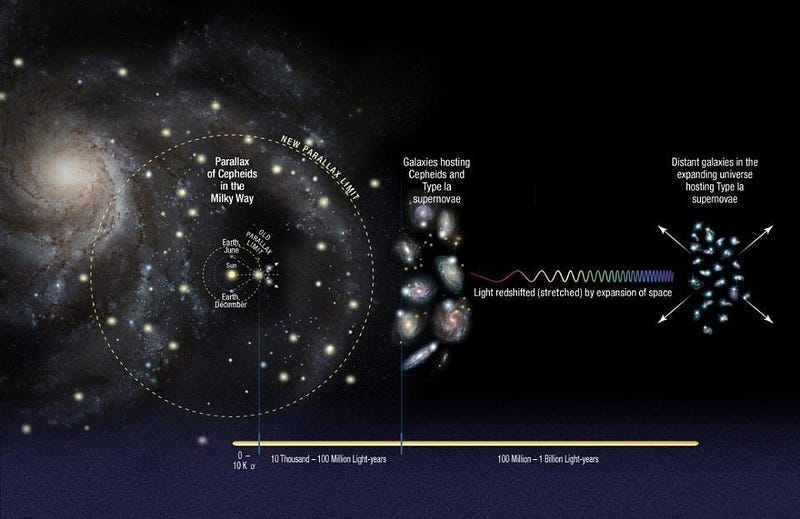
But the third piece of the puzzle, which involves the direct measurements of distances and redshifts of individual objects, has gotten to be tremendously more precise over the past decade. The traditional method uses what’s known as the cosmic distance ladder, where the best measurements come from:
- parallaxes are measured to get the distance to individual stars,
- individual stars are measured in nearby galaxies which also house type Ia supernovae,
- and type Ia supernovae are then measured all across the Universe,
yield a much higher value: 73–74 km/s/Mpc, with just a 2% uncertainty.
Over the past few years, a large number of other lines of evidence have come in using different methods that measure the distances and redshifts of individual objects. Different distance indicators include:
- using surface brightness fluctuations of distant galaxies instead of type Ia supernovae,
- using stars at the tip of the red giant branch instead of Cepheid variables,
- using gravitational lenses of quasars as a completely independent method,
- or using geometric distance measurements to galaxies that host astronomical phenomena known as megamasers.
Remarkably, every single one appears to agree with the distance ladder measurements, yielding values between 72–76 km/s/Mpc, with no set of measurements preferring the lower value of 67 km/s/Mpc.
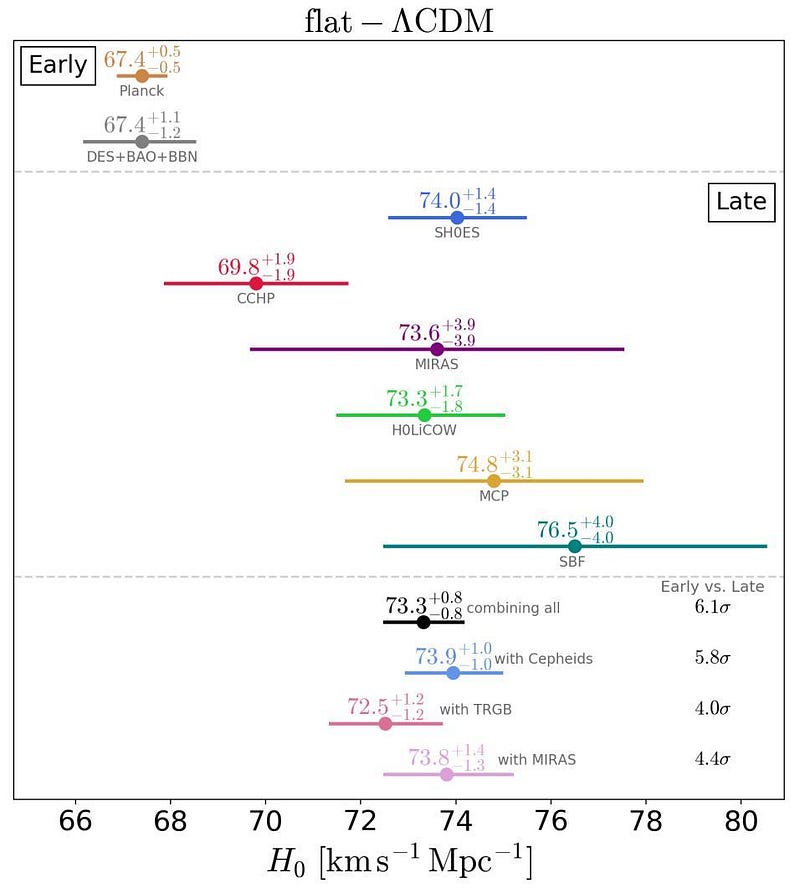
What’s notable about this discrepancy is that the types of measurements that the ones that lead to a lower value are anchored at the earliest stages of the Universe, based on the physical interplay of dark matter, normal matter, and radiation over the first few 100,000 years since the Big Bang, while the ones that lead to a higher value are based on direct measurements from our perspective to distant objects. While many scenarios have been proposed to account for this, there hasn’t been a direct probe of how the expansion rate differs between early-time and late-time measurements.
But on January 29, 2020, a new paper was released that explicitly used one of the early-time techniques — that of the Universe’s large-scale structure — and restricted themselves to late-time measurements alone, without an early Universe anchor. What they found was fascinating: the expansion rate was measured to be 72.3±1.9 km/s/Mpc, consistent with other late-time measurements.
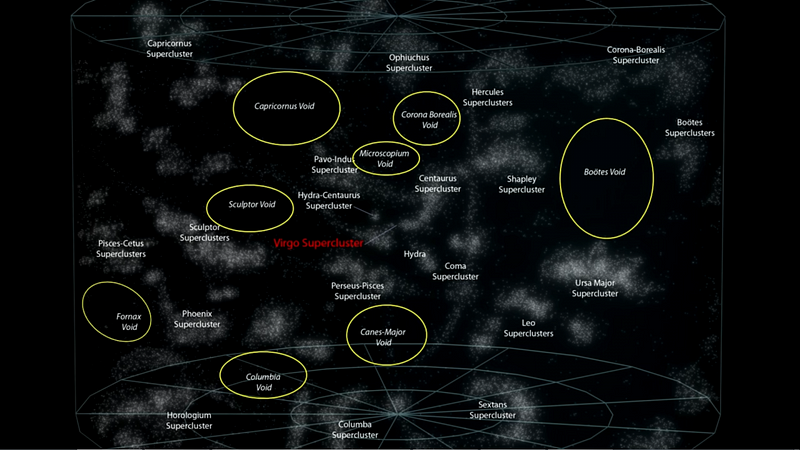
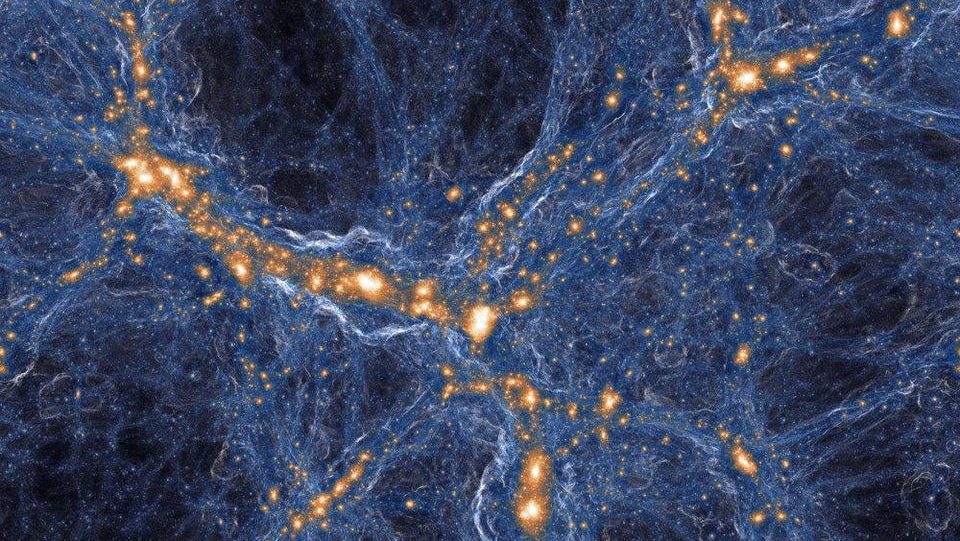
The biggest achievement of the new paper is to factor in the effect of cosmic voids: the vast and largely empty regions of space that exist between the strands of the cosmic web that trace out our Universe’s large-scale structure. On its own, with this new technique, the large-scale structure of the Universe provides overwhelming evidence for dark energy — at more than 10-sigma significance, a greater margin than even supernovae — completely independent of the cosmic microwave background.
What’s most remarkable, however, is that galaxies and quasars that cluster in the nearby, late-time Universe, with no other measurements or assumptions factored in, prefer an expansion rate of 73.7 km/s/Mpc, albeit with about a 4–5% uncertainty. Adding in the void measurements reduces the value slightly but greatly reduces the uncertainty: to 72.3 km/s/Mpc, with an uncertainty of 2.6%.
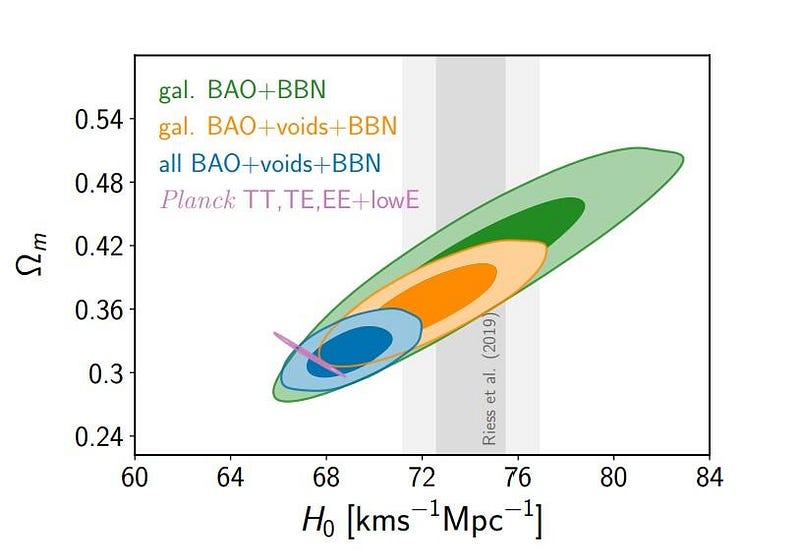
However, adding in galaxies and quasars that cluster in the ultra-distant, early-time Universe drags the value way back down: to 69.0 km/s/Mpc, with an uncertainty of ~1.7%, which is interesting for two reasons.
- It shows that factoring in the measurements of cosmic voids is extremely important in reconstructing the expansion rate of the Universe, as large-scale structure measurements without those voids gave 67.6 km/s/Mpc, as opposed to the new analysis that includes the voids and is ~2.1% higher.
- It shows that if you measure the expansion rate of the Universe relatively nearby exclusively, you get a systematically higher rate of expansion as opposed to using the full set of data, even when using the same technique.
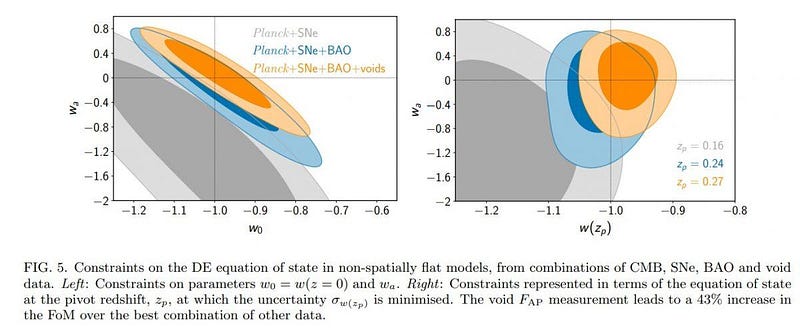
Although the same paper finds no evidence that dark energy evolves with time, it’s another fascinating clue in this ongoing cosmic saga.
It’s definitely the case that different methods of measuring the expanding Universe give different values, but this is the first time that the same method has yielded two different results depending on whether you look at the full data set or the late-time measurements alone. The expansion rate of the Universe has been one of the most contentious issues in all of modern science — the Hubble space telescope was even named for its main science goal of measuring that rate, also known as the Hubble constant — and this new result provides a major clue.
Could factoring the effect of cosmic voids in all measurements account for the full discrepancy? Could we be seeing evidence that something, even if it’s not dark energy, is evolving in the Universe in an unexpected fashion? Or, quite possibly, could this be a suggestion that it’s the cosmic microwave background data that’s somehow mistaken, after all? One thing is clear: more and better data, which should be on the way with Euclid, LSST, and WFIRST, will help us decide.
Ethan Siegel is the author of Beyond the Galaxy and Treknology. You can pre-order his third book, currently in development: the Encyclopaedia Cosmologica.