Sign up for Big Think on Substack
The most surprising and impactful new stories delivered to your inbox every week, for free.
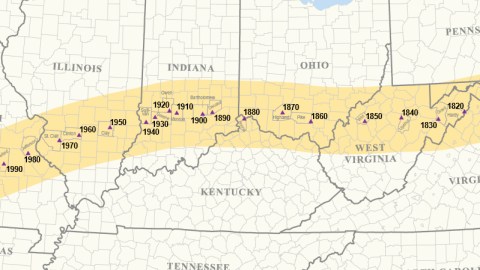
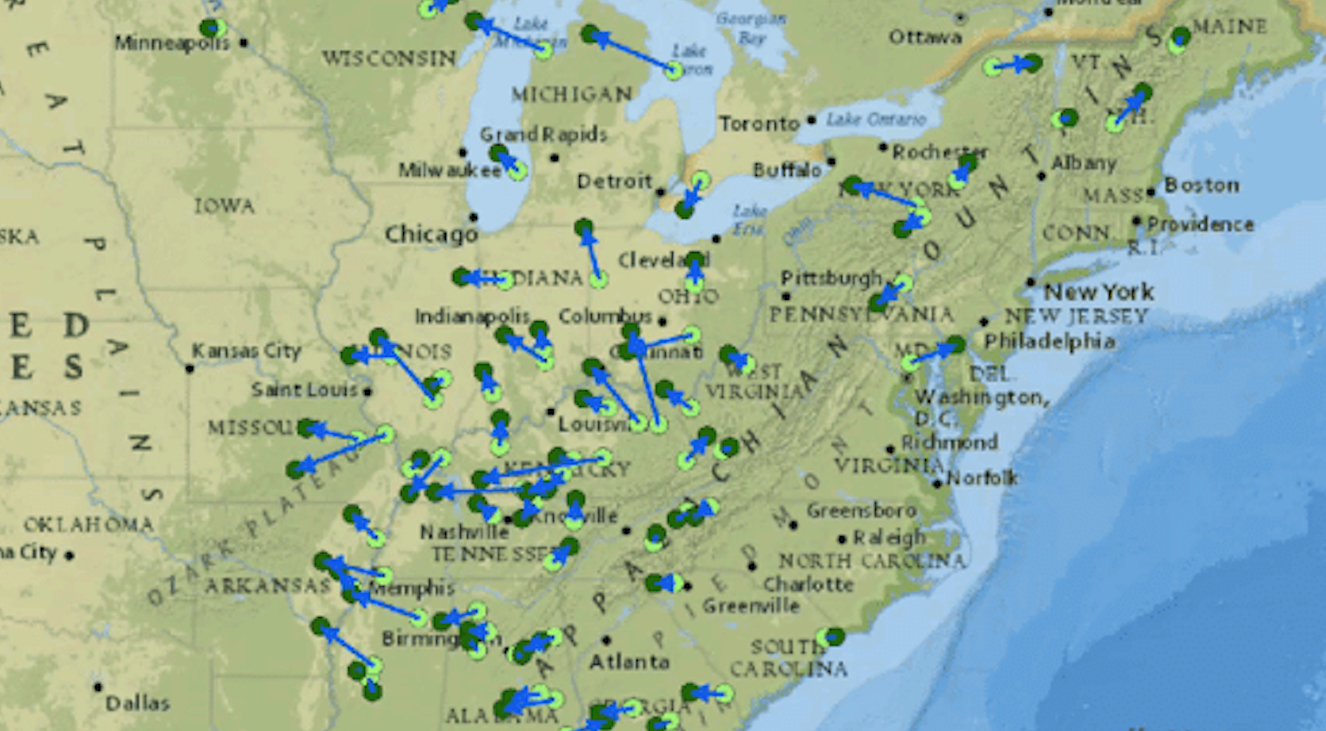
The mean centre of US population is “the point at which an imaginary, flat, weightless and rigid map of the US would balance perfectly if weights of identical value were placed on it so that each weight represented the location of one person on the date of the census”, in the definition of the US Census Bureau itself.
That bureau has been holding censuses every decade since 1790; these censuses form the backdrop for this string of mean centres of population in the US. The map shows an ever westward shift of that centre, obviously in parallel with the westward expansion of the US and its citizenry. The mean centre of population of the US has shifted thusly:
1790: 23 miles east of Baltimore (MD)
1800: 18 miles west of Baltimore (MD)
1810: 40 miles northwest by west of Washington, DC
1820: 16 miles east of Moorefield (VA, now WV)
1830: 19 miles west-southwest of Moorefield (VA, now WV)
1840: 16 miles south of Clarksburg (VA, now WV)
1850: 23 miles southeast of Parkersburg (VA, now WV)
1860: 20 miles south by east of Chillcothe (OH)
1870: 48 miles east by north of Cincinnati (OH)
1880: 8 miles west by south of Cincinnati (OH)
1890: 20 miles east of Columbus (IN)
1900: 6 miles southeast of Columbus (IN)
1910: in the city of Bloomington (IN)
1920: 8 miles south-southeast of Spencer (IN)
1930: 3 miles northeast of Linton (IN)
1940: 2 miles southeast by east of Carlisle (IN)
1950: 3 miles northeast of Louisville (IL)
1960: 6-1/2 miles northwest of Centralia (IL)
1970: 5 miles east-southeast of Mascoutah (IL)
1980: 1/4 mile west of DeSoto (MO)
1990: 10 miles southeast of Steelville (MO)
2000: 3 miles east of Edgar Springs (MO)
2010: 2.7 miles northeast of Plato (MO)
This list refers to the nearest city, which might be in a different state than the mean centre itself. For a more complete listing, including precise sets of decimal coordinates, please see this Wikipedia article.
Some mean centre trivia:
The very first census mean centre was near Chestertown in Maryland – very close to the nation’s capital (the location of which was chosen exactly for its centrality). Westward expansion has made Washington DC increasingly eccentric, not just in a literal, geographic sense, but also by the steady eastward “mean streak” of its statistical population centre, depicted here.
The most appropriate mean centre surely was the one near the very aptly named town of Centralia, Illinois (1960).
The addition of Hawaii and Alaska to the Union (in 1959) didn’t cause as much of a shift as one might expect : it moved the mean centre only two miles south and ten miles west (1960).
The U.S. Census Bureau has not published the updated 2015 population midpoint; earlier estimates showed it would have moved from Texas County to Wright County, Missouri, 8 miles southwest of Plato.By 2020, the mean centre is still projected to be Wright County, now 8.3 miles north of Hartville.
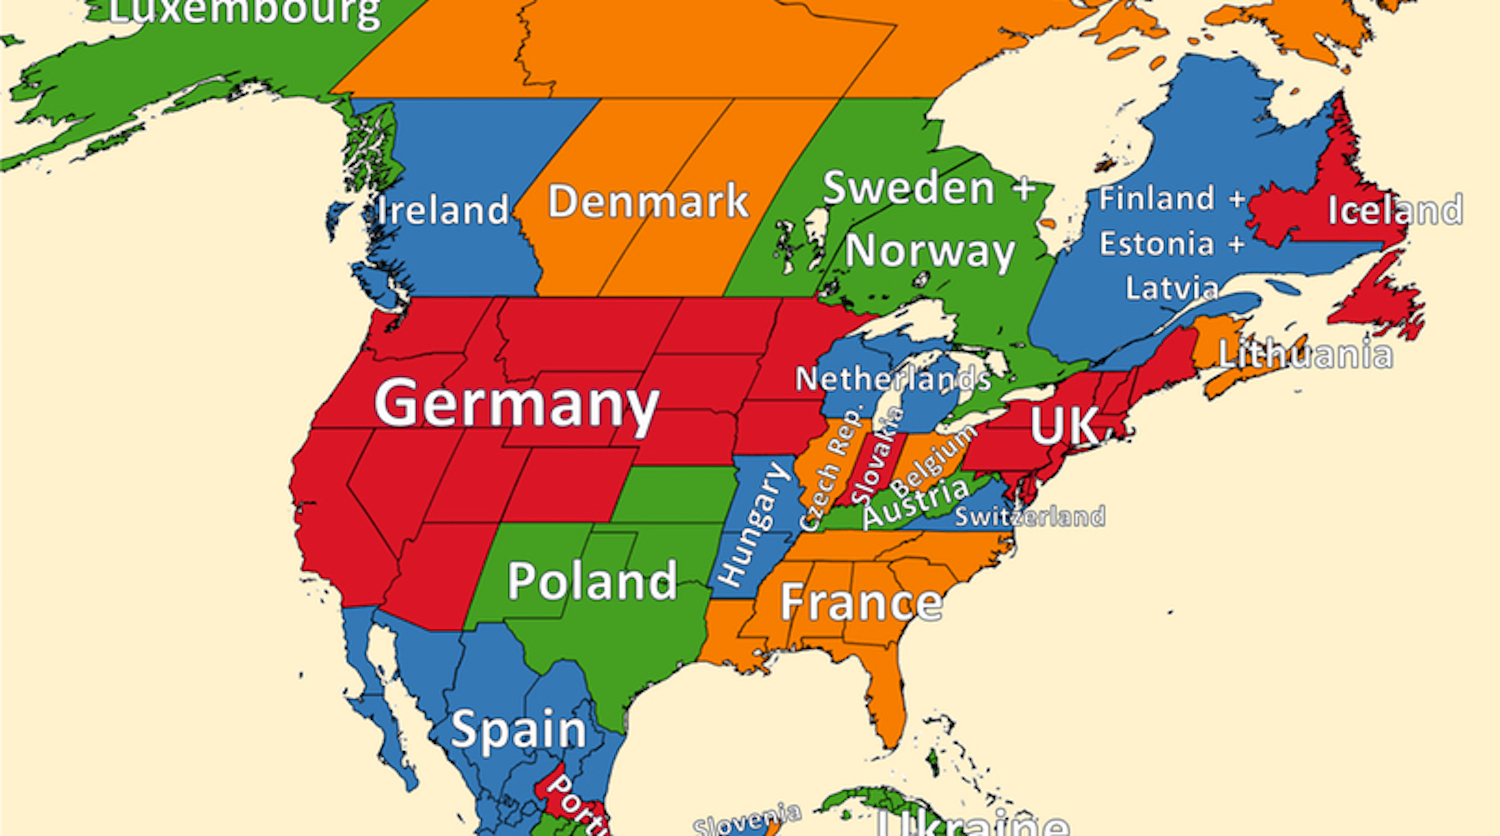
The mean centre of the European Union has moved in the opposite direction, as the EU has continued to expand into Eastern Europe.
Many thanks to Kees Huyser for alerting me to this map, illustrating the aforementioned Wikipedia article.
Strange Maps #389
Got a strange map? Let me know at strangemaps@gmail.com.
Sign up for Big Think on Substack
The most surprising and impactful new stories delivered to your inbox every week, for free.