The skull maps that quantified racism
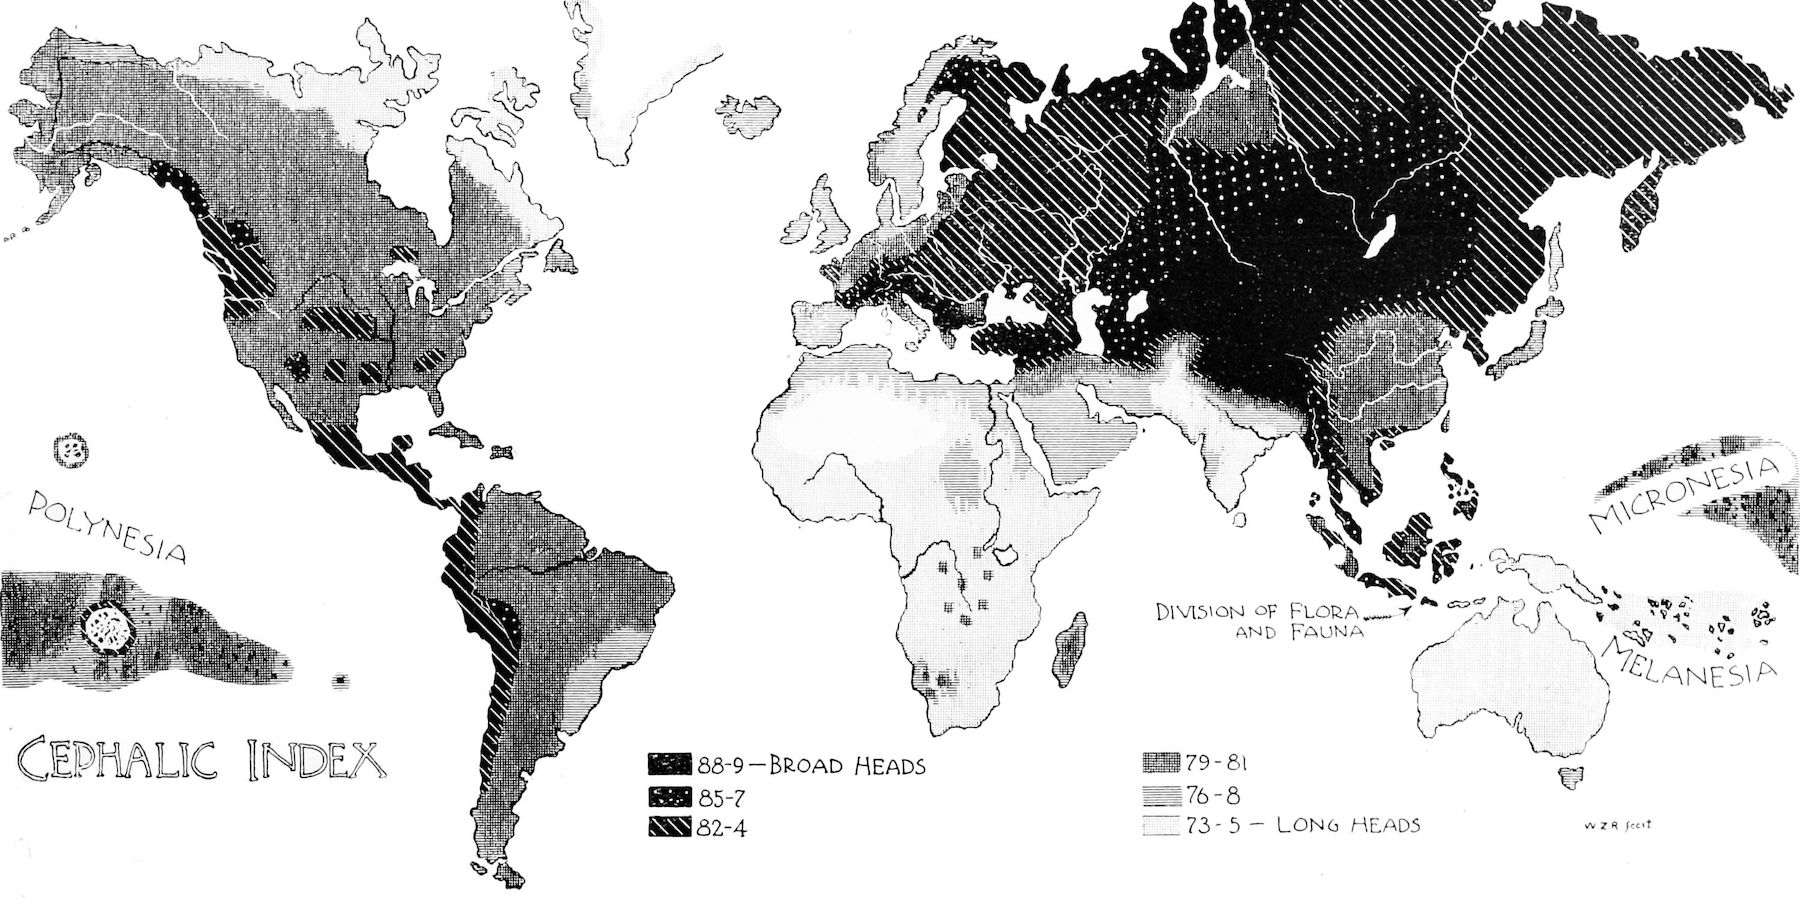
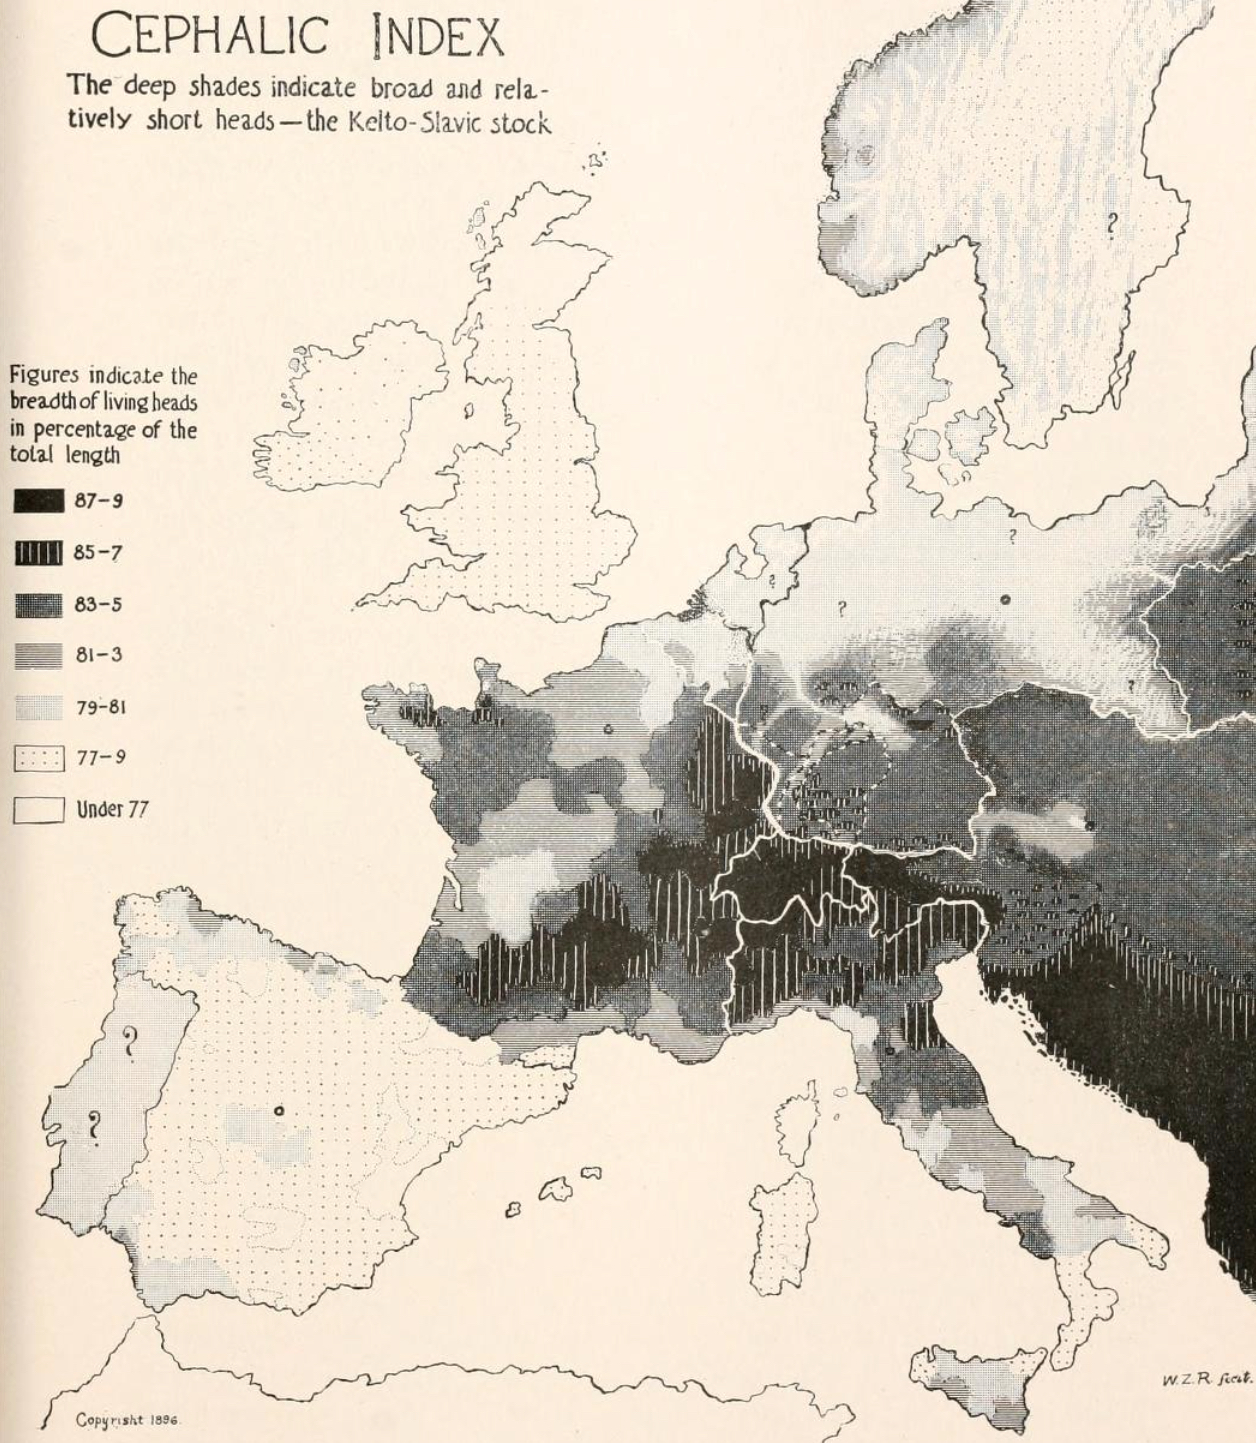
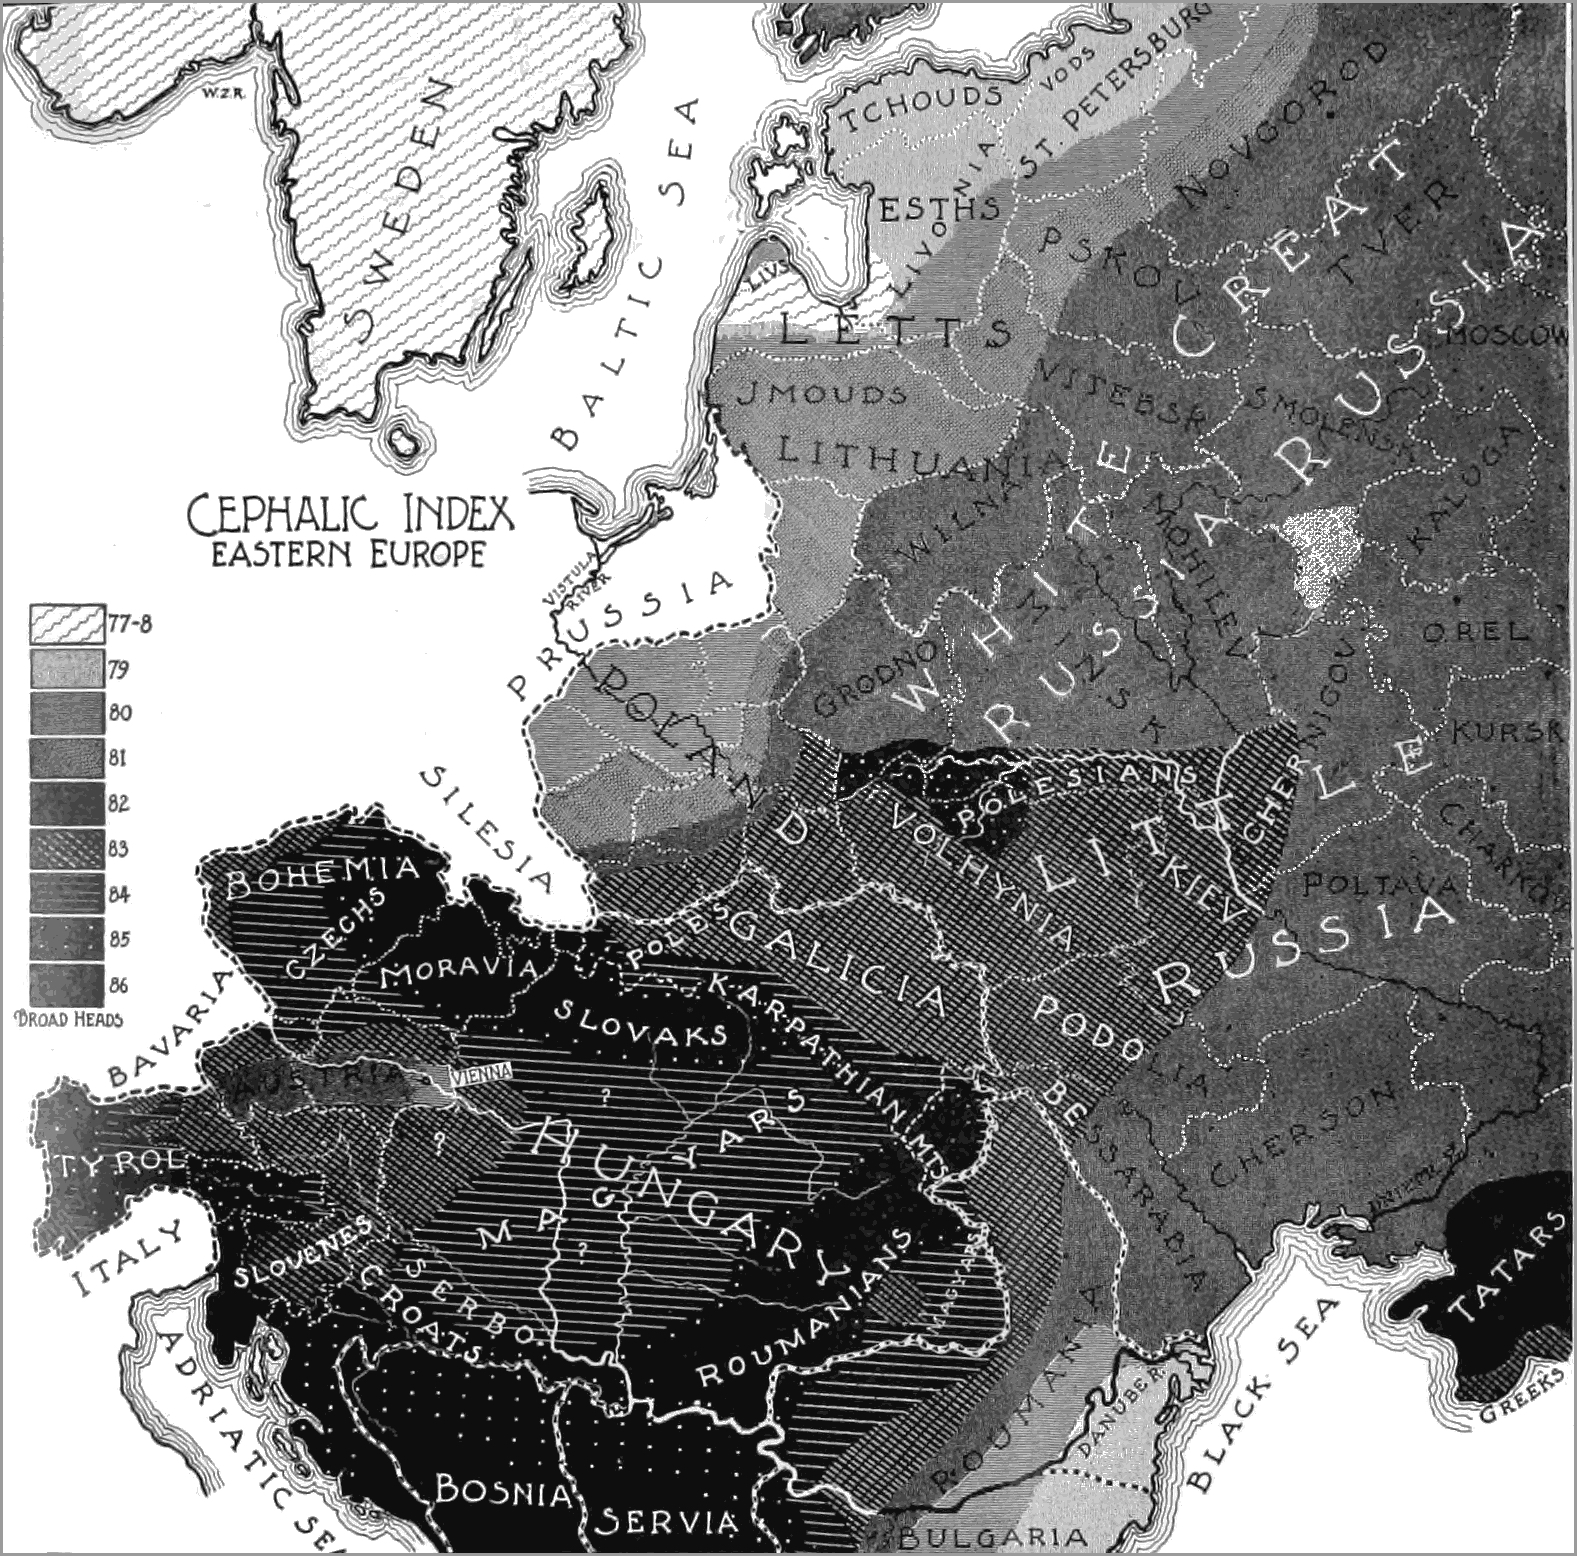
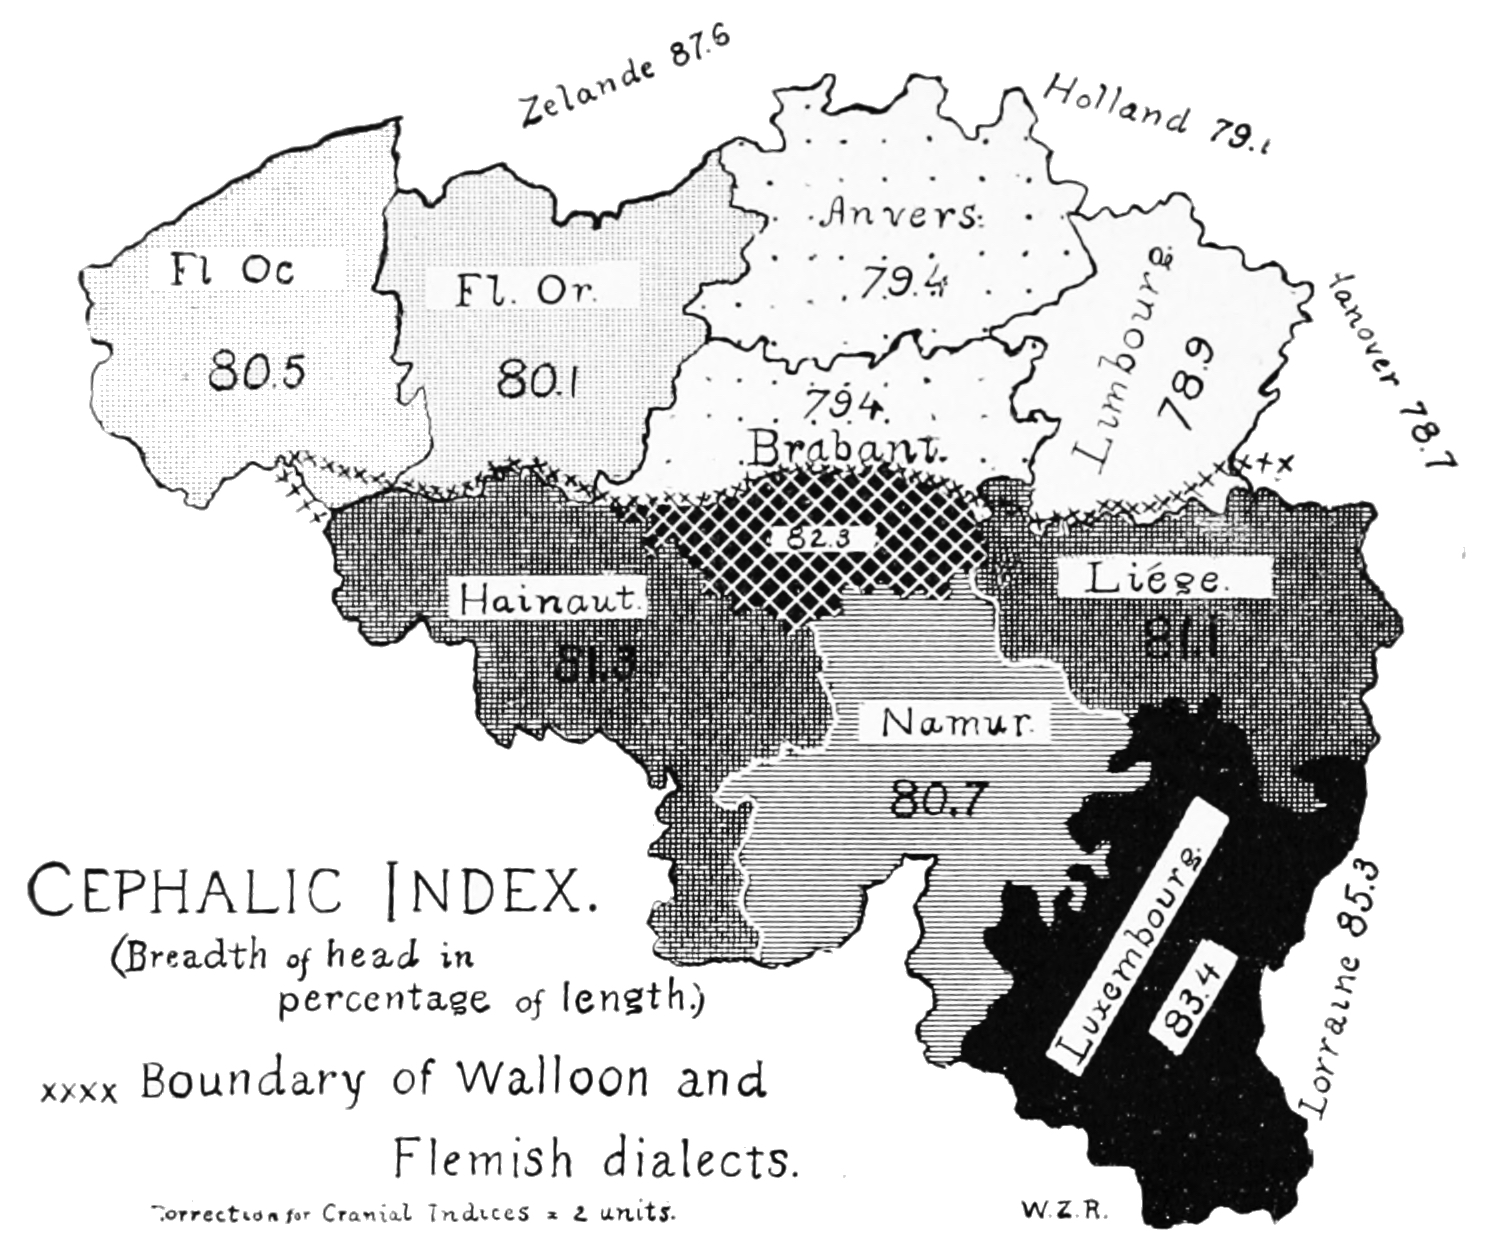
- These maps show the landscape of human skull shapes: round, long, and in between.
- “Long” and “short” heads were seen as elements of racial categorization.
- This so-called Cephalic Index has gone out of fashion after WWII — except for cats and dogs.
Most people who read these century-old maps today will pass through three stages of interpretation: honest curiosity, morbid fascination, and intellectual disgust.
A landscape of human skull shapes
These black-and-white maps are aesthetically attractive as well as invitingly strange. The divisions they display for the most part don’t correspond to any familiar type of boundaries — political, natural, or cultural. So what do they denote? They’re showing the geographic distribution of something called the “Cephalic Index,” using the Greek word for “head.” To be more precise: these maps plot a landscape of human skull shapes.

What ghoulish imagination is at work here? What exactly are those cranial differences? And why are they important? The answer to all three questions is “scientific racism.” The briefest possible definition of that term is “the quantification of prejudice.”
A prime example of scientific racism
Scientific racism was a popular and influential school of thought in the late 19th and early 20th centuries. Its central tenet was that measurable physical differences between people can be grouped into racial categories, and that those can be linked to certain variations in human behavior.
The maps shown here are all the work of William Z. Ripley (the middle initial stands for Zebina). His book, The Races of Europe (1899), is a prime example of this pseudoscientific approach to anthropology, but it was relatively non-controversial at the time.
Ripley was a man of various talents. A lecturer on sociology at Columbia and a professor of economics at Harvard, he was particularly influential in U.S. railway policy. He held various important government posts in the first decades of the 20th century, including Administrator of Labor Standards in the Department of War (1917-18). He was a staunch critic of Wall Street, with some saying he predicted the 1929 crash. In 1933, he was elected president of the American Economics Association.
The three races of Europe
In his side gig as a racial anthropologist, Ripley used several variables to measure racial differences in Europe, including a population’s average height, blondness, and skull shape.
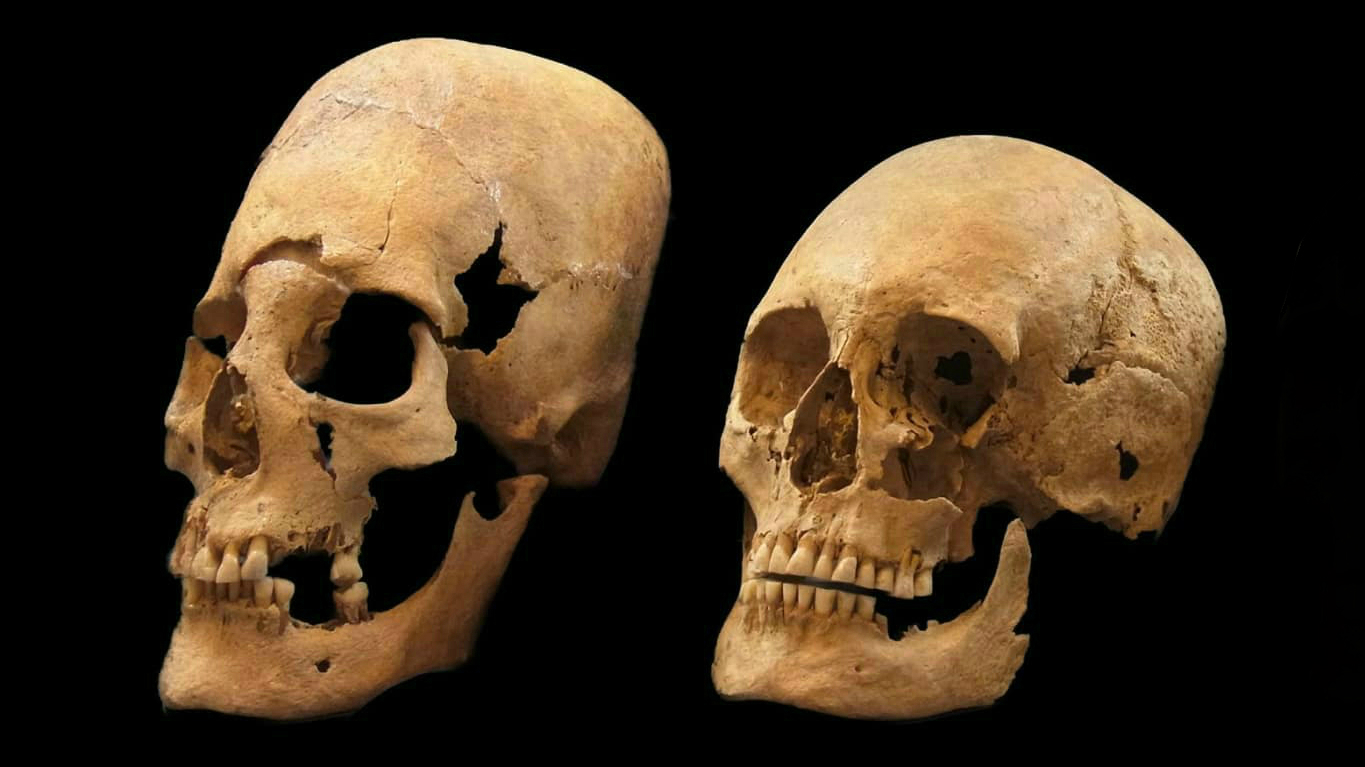
The Cephalic Index is the maximum width of a skull multiplied by 100, divided by its maximum length. A result below 75 indicates a dolichocephalic type (a “long” head); a result above 81 for men and 83 for women indicates a brachycephalic type (a “short” head); a result in between is a mesocephalic type (a “medium” head). From his data, Ripley concluded that there were three races in Europe:
- The Teutonic (or “northern”) race, generally tall, light of hair and eye color, and long-headed (dolichocephalic).
- The Alpine (or “central”) race, who are of medium build, have “intermediate” hair and eye color, and are short-headed (brachycephalic), sometimes also called round-headed or broad-faced.
- And the Mediterranean (or “southern”) race: short, dark-haired, and dark-eyed, but also long-headed.
Ripley’s racial triage was not universally accepted. Some maintained there was just one European race. Conversely, Joseph Deniker, Ripley’s greatest rival, identified no fewer than ten different European races: six primary ones (including Littoral, Adriatic, and Ibero-Insular), and four subtypes (including Sub-Nordic and Vistulian).
There were other categorizations, each as equally subjective. The Races of Europe was nevertheless one of the more influential works of its kind, and not in a good way. Here’s a typical sentence from the book: “Normandy is today one of the blondest parts of France. It is distinctly Teutonic in the head form of its people.”
A crude and ineffective means of racial categorization
The whole book makes for similarly uncomfortable reading. That’s because Ripley’s concept of the Teutonic race needed just a few ideological tweaks to form the “scientific” basis for the superiority of the Germanic master race, as championed by the Nazis.
Nowadays, the Cephalic Index (CI) is generally considered a crude and ineffective means of racial categorization. Early-20th-century research in the U.S. showed that second-generation immigrants had a significantly different CI from their parents, indicating that nutrition (and perhaps other environmental input) was as much a factor as genetics.
Unsurprisingly, scientific racism was largely abandoned after World War II. In its 1950 publication “The Race Question,” UNESCO stated that “the biological fact of race and the myth of ‘race’ should be distinguished. For all practical social purposes, ‘race’ is not so much a biological phenomenon as a social myth.”
Measuring cats and dogs
Most biologists and anthropologists today reject the partitioning of humans into distinct races, maintaining instead that all variation between humans falls well below the subspecies level. Everyday concepts such as “ethnicity” and “race” are, in current scientific terms, sociocultural and quasi-biological constructs.
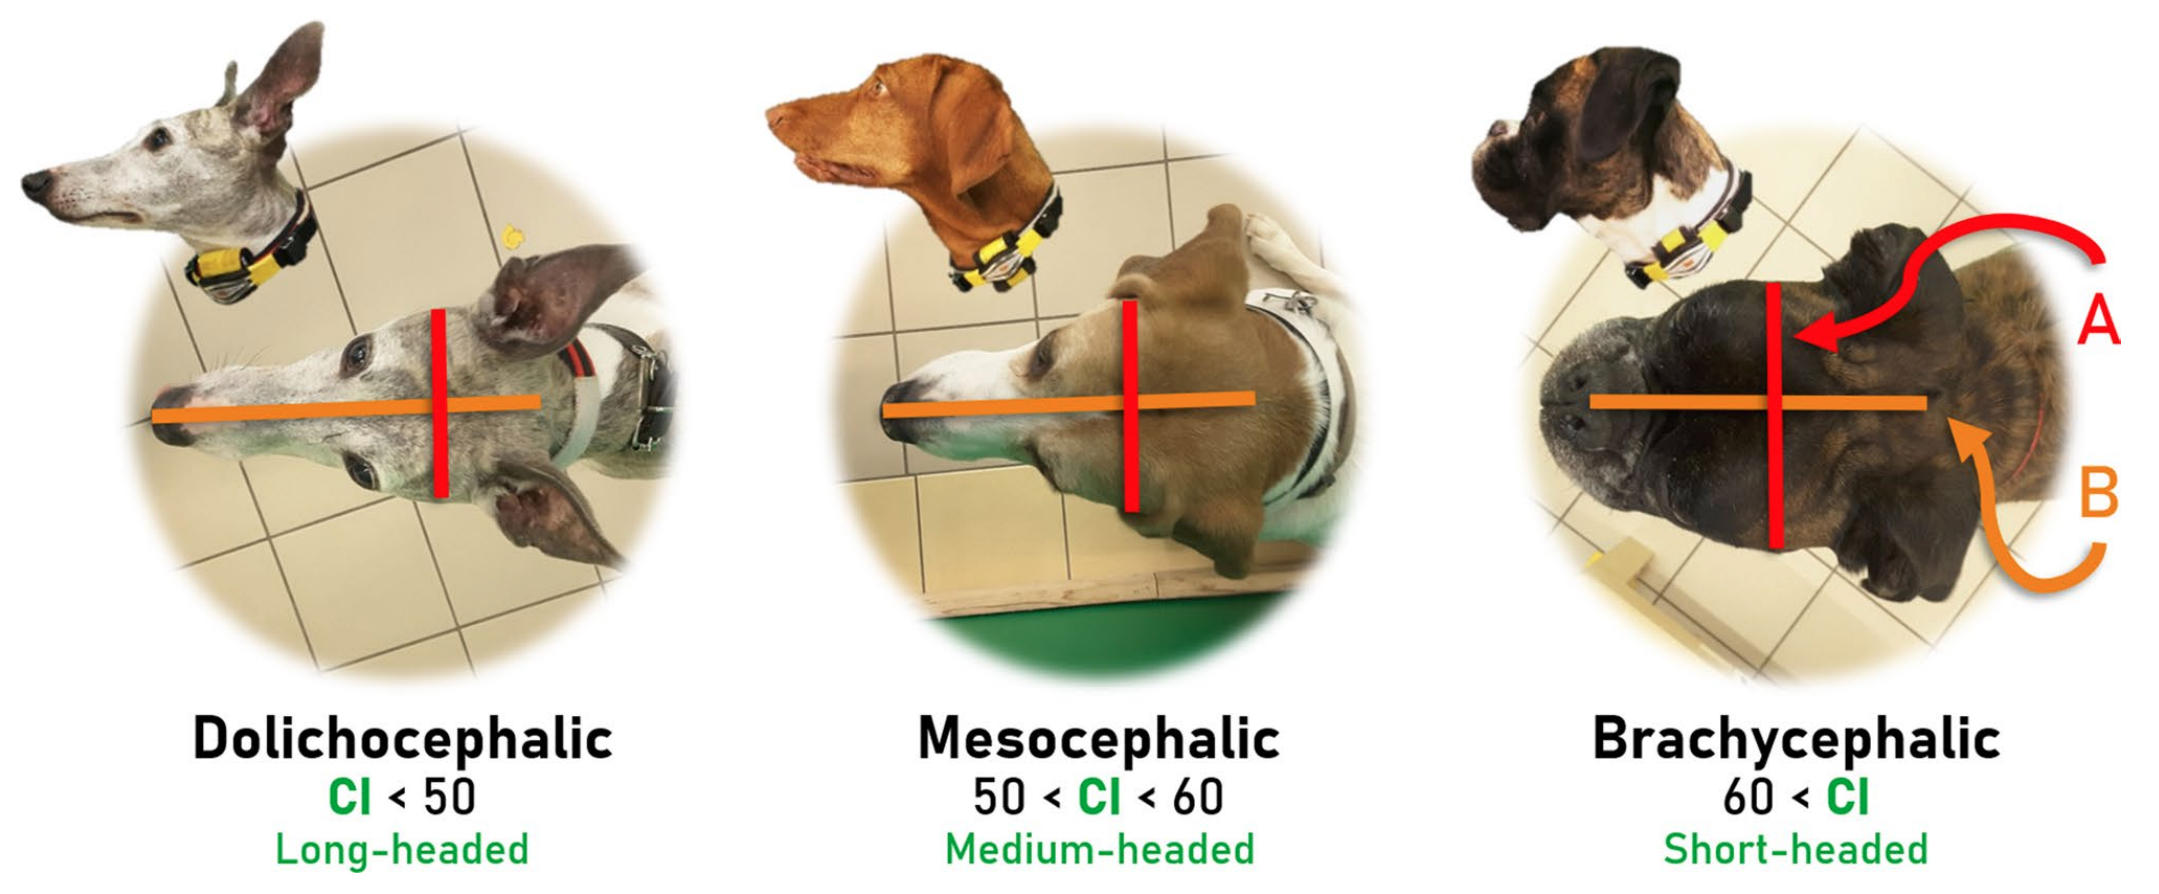
The Cephalic Index is still around today, but no longer to categorize humans. These days its main use is to help identify the various breeds of cats and dogs.
Strange Maps #1217
Got a strange map? Let me know at strangemaps@gmail.com.
Follow Strange Maps on Twitter and Facebook.
