Norway has highest share of women scientists and engineers in Europe

Credit: Eurostat
- Norway’s 55% of women in science and engineering is a massive improvement over the past two decades.
- 20 years earlier, just over a third of Norwegian scientists and engineers were women.
- Europe overall progressed from 30% to 41%, but some countries saw a dramatic drop.

Women scientists and engineers are in the majority in five countries across Europe.Credit: NASA, CC BY 2.0 / Infographic: Ruland Kolen
In Norway, 55 percent of all scientists and engineers last year were women. That is more than in any other country in Europe (1). In 2019, only four other European countries had female majorities in science and engineering: Lithuania (just under 55 percent), Latvia (52.7 percent), Denmark (51.7 percent) and Bulgaria (just over 50 percent); see graph.
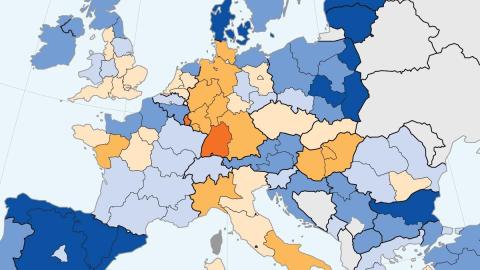
Throughout Europe, stark differences persist in the participation level of women in science and engineering; as this map of Europe’s NUTS1 regions (2) demonstrates, those differences show up not just between but also within European nations – and not always where you’d expect them.
The worst-performing countries were Luxembourg (just below 28 percent), Finland (30.5 percent), Hungary (32.6 percent) and Germany (33.3 percent). But Germany contains both the state of Mecklenburg-Vorpommern (45.6 percent), well above the EU27 average; and Baden-Württemberg (29.1 percent), the worst performing NUTS1 region in Europe outside Luxembourg.

Shades of orange: less than 40% of women in science and engineering. Shades of blue: more than 40%. Dark blue: more than 50%.Credit: Eurostat
This map was published by Eurostat, the EU’s statistical office, on February 11, the International Day of Women and Girls in Science. Eurostat has data going back 20 years, showing serious progress towards gender parity in science and engineering across Europe, as well as some setbacks.
In 2002, the first year for which figures are available for the entirety of the current 27-member European Union (EU27), women scientists and engineers represented 30.3 percent of the total. Last year, after 17 years of steady rise, that figure had reached 41.1 percent. That represents 6.3 million women scientists and engineers, versus 9.1 million men working in those fields (adding up to a total of 15.4 million scientists and engineers in the EU).
The largest gains were made in:
- Switzerland, where the share of women scientists and engineers increased by 30.6 percentage points over 20 years, from just 10.7 percent in 1999 to 41.3 percent in 2019.
- Denmark, which saw its share rise by 26.9 percentage points over the same period, from 24.8 percent.
- Norway, where the share rose by 19.8 percent, from just 35.3 percent in 1999.
- And France, which saw a 17.2-point increase from 28.9 percent in 1999 to 46.1 percent in 2019.
However, increases were not the norm everywhere. In some countries, the share of women in science and engineering actually went down.
- Nowhere more than in Finland, where women had a slight majority in 1999 (50.9 percent) but fell back by 20.4 points to less than a third (30.5 percent) in 2019.
- Estonian women also lost their majority in science and engineering, dropping from 52.4 percent in 1999 to 43.6 in 2019.
- In Hungary, women lost 5.9 percentage points over two decades, falling from 38.5 percent to 32.6 percent.
- And in Belgium, the female share of scientists and engineers fell back from 47.9 percent in 1999 to 44.8 percent in 2019.

Women scientists and engineers were least present in manufacturing (21%), while the services sector was much more balanced (46% women).Credit: NASA, CC BY 2.0
At the regional level, the discrepancies are even more pronounced.
- Three NUTS1 regions have higher shares of female scientists and engineers than Norway: the Portuguese region of Madeira (56.8 percent), North and Southeast Bulgaria (56.6 percent) and Northern Sweden (56.4 percent).
- Spain only just misses out on reaching half overall, but has five regions that pass the mark: North-East (53.2 percent), East (52.1 percent), Canary Islands (51.9 percent) North-West (51.7 percent), and Centre (51 percent).
- Poland, slightly lower, manages two regions over 50 percent: East (54.5 percent) and Central (50.9 percent).
- Even further down the list, Turkey nevertheless has three regions which also score over half: Orta Anadolu (51.9 percent), Akdeniz (50.9 percent) and Kuzeydogu Anadolu (50 percent).
- Contrasting with the balanced scores in these sub-regions are the NUTS1 regions in western Europe where women are underrepresented, notably the whole of Italy (<40 percent) and the western half of Germany (<35 percent).
Considering the various economic sectors, Eurostat notes that women scientists and engineers were least present in manufacturing (21 percent), while the services sector was much more balanced (46 percent women).
Map and data found here at Eurostat.
Strange Maps #1069
Got a strange map? Let me know at strangemaps@gmail.com.
(1) For the purpose of this map, ‘Europe’ comprises the EU plus a number of adjacent states: Iceland, Norway, the UK, Switzerland, Serbia, Montenegro, North Macedonia and Turkey.
(2) NUTS stands for Nomenclature d’unités territoriales statistiques, French for ‘Classification of Territorial Units for Statistics’, an EU-developed standard with three geographical levels. The first one is large enough to include smaller countries in their entirety. Luxembourg is small enough to be a single NUTS region on all three levels.


