Analyze learning programs in real- time
Show the value of learning with clear dashboards and metrics that matter.
Support your business objectives
Connect learning programs to your business objectives with real-time dashboards and reports.
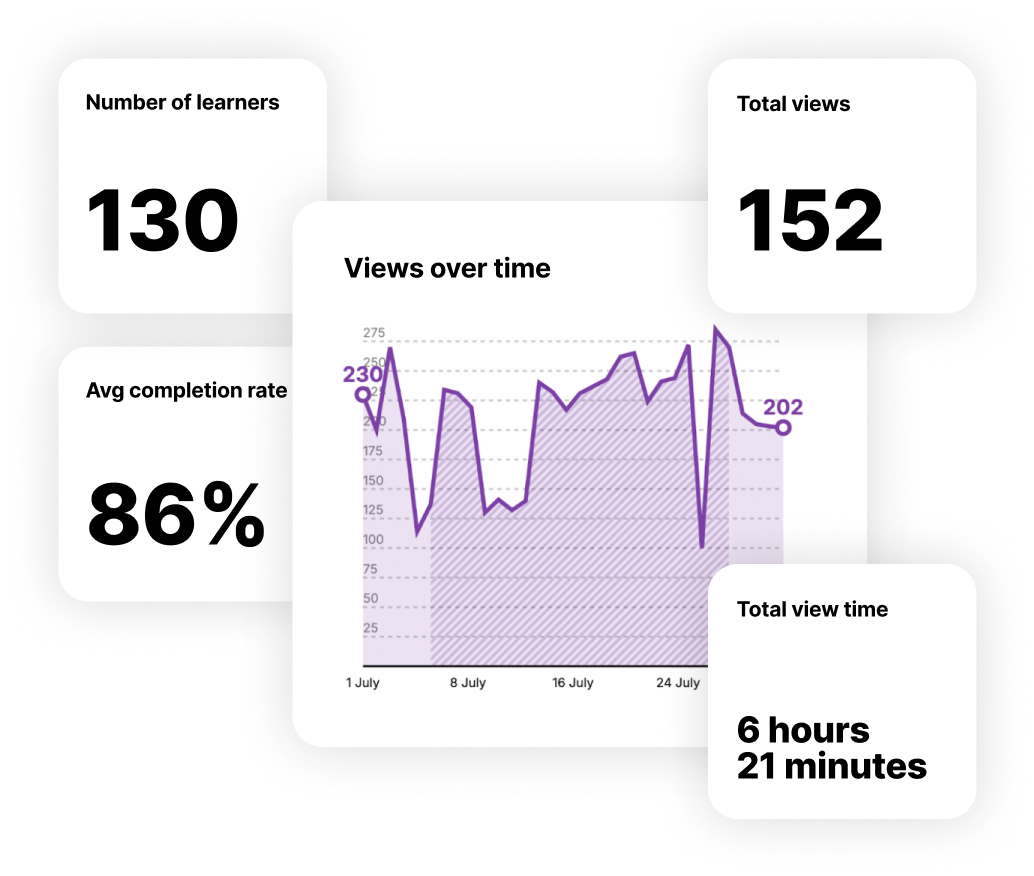
With Big Think+ Analytics, learning leaders have access to the data they need, when they need it. Straightforward dashboard and reporting tools make it easier than ever to share the value of learning with your organization.
Generate deep insights on learners, content usage, and key trends that will inform program improvements and deeper learner engagement. Real-time data points–like watchtime, completion rates, and content ratings–are simply organized and sortable for quick insights.
Understand user patterns & behavior
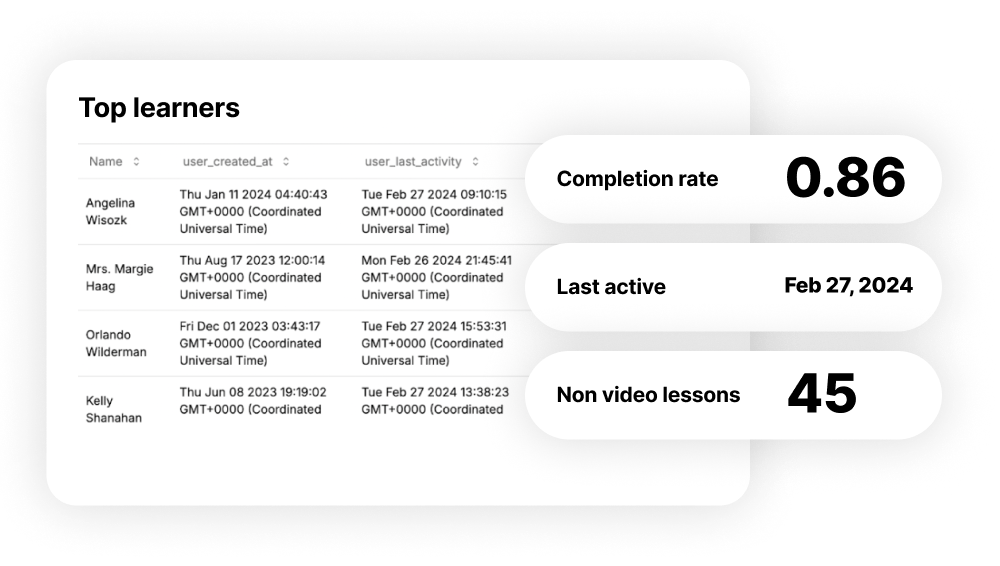
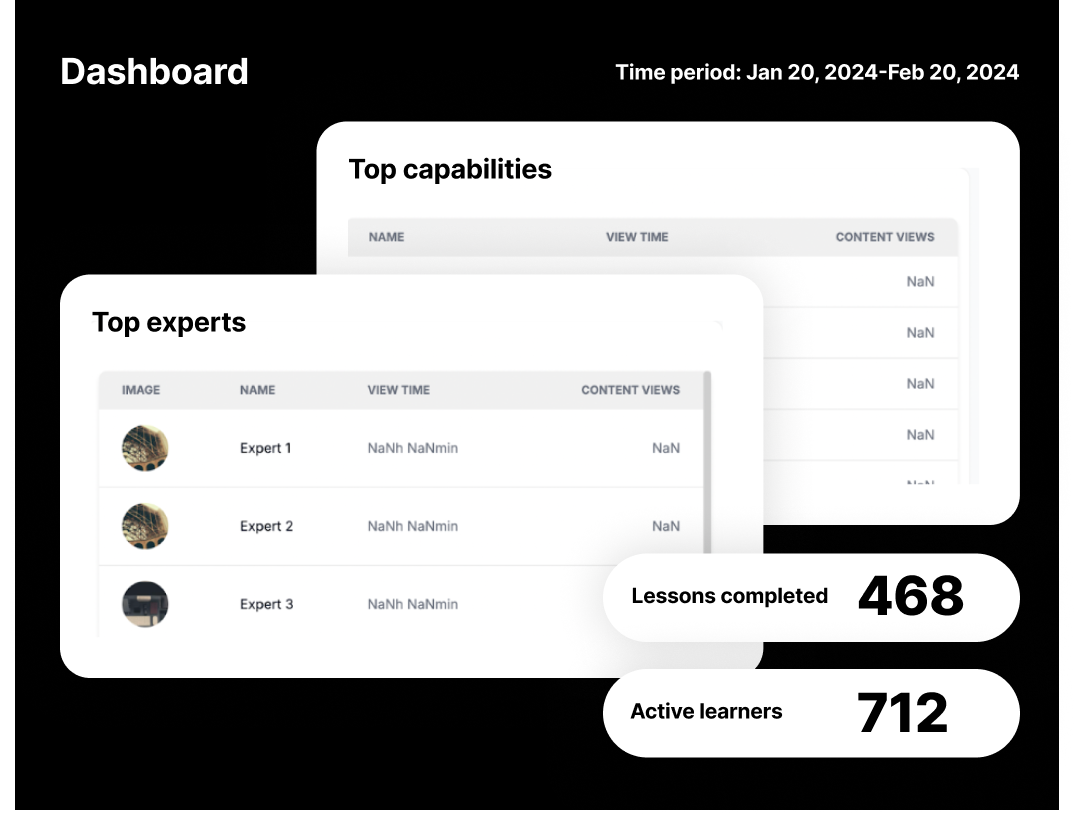
Learner usage analytics help you to quickly uncover which users are watching, engaging with, and valuing the Big Think+ learning experience. Whether you’re looking for general usage patterns, monthly and weekly reports, or insights on specific initiatives, you’ll always have the data you need to support key decisions.
Because optimizing your learning programs for engagement is critical, Big Think+ Analytics is organized to facilitate action. Immediately see what’s working and what’s not within your organization, and customize your program to improve learning.
Instantly identify which content is resonating with your learners.
If quality content is the body of your learning program, content analytics is the brain. Having instant access to a variety of easy-to-use content reports will enable healthy and always-improving content experiences for learners. Answer important questions like:
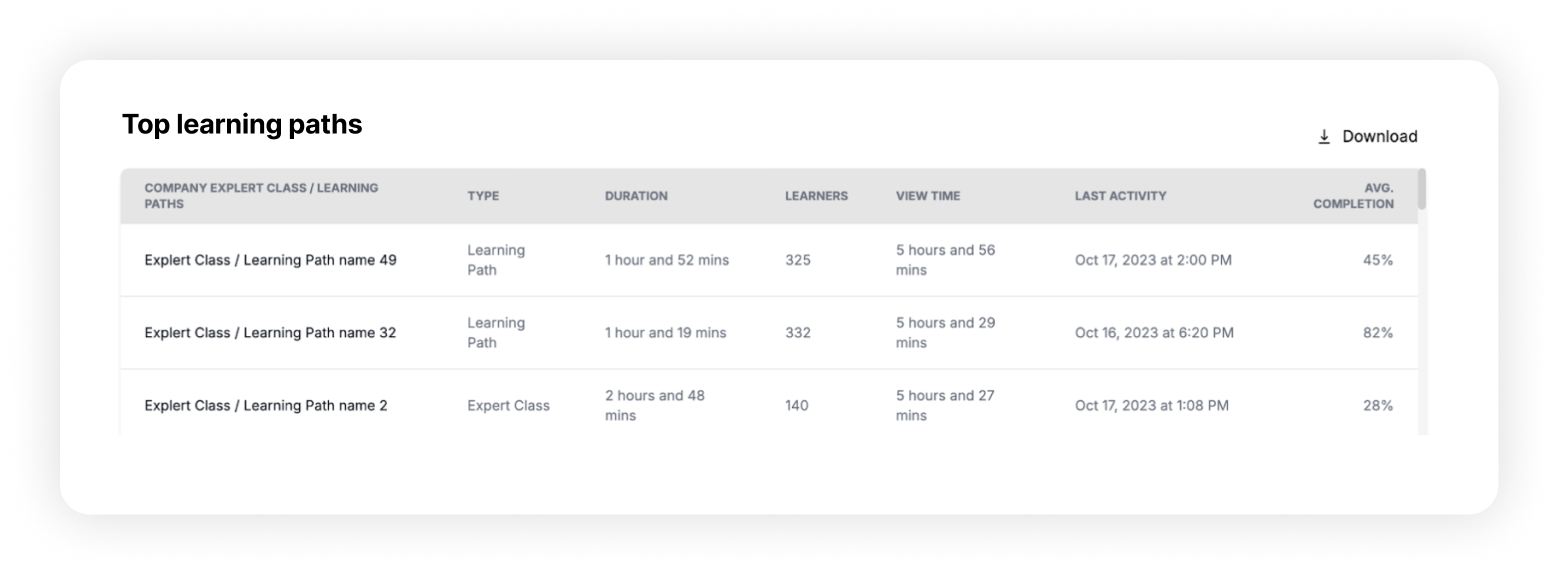
What’s trending among your learners? Harness lessons, learning paths, and courses with high traffic in your next curation.
How are learners responding to your learning program? Curation analytics let you see learner engagement, completion, and total learning time of curations published or shared within your organization.
What ideas are my learners interested in? Learning path and expert class analytics reveal topics that appeal to your organization’s learners, so you can build engaging and impactful programs.
By analyzing content usage across different formats, Big Think+ Analytics equips you with the deep insights you need to better understand learning and development across your organization.
Ready for a demo?
We’re excited for your organization to start using Curations today and get even more out of your Big Think+ experience. Want a personalized demo? Request one now and we’ll set up a time to talk your through it.
Stay up-to-date with BT+
Join 30k+ L&D professionals for trends, research, and strategies in leadership development